RETENTION MARKETING
The Order 2–4 Cliff: Where LTV Quietly Dies

Written by
September 14, 2026

Why most cohort LTV is lost between orders 2 and 4 — and the five interventions that bend the curve.
Why Healthy DTC Brands Have a Hidden Churn Cliff Between Orders 2 and 4
The headline numbers look good. Revenue is up, acquisition is up, the team is hitting CPA targets. But buried in the cohort tables is a curve that should bend smoothly and doesn't: a persistent drop-off between orders 2 and 4 that's been there for three quarters. Most brands never dig into it. The ones who notice can't quite tell whether it's a tactics problem, a creative problem, or something deeper. By the time it shows up in CAC payback or LTV:CAC, the drift has been compounding for a year.
This is the Order 2–4 cliff: the drift in repeat-purchase economics that caps the LTV of every customer cohort a brand acquires. It isn't seasonal. It isn't a creative refresh problem. It isn't unique to subscription. It shows up in skincare, supplements, coffee, household care, premium pet — anywhere repeat purchase is the business model rather than the upside.
And it doesn't start at order 2. It starts in the funnel. The way acquisition wins is exactly what produces a customer who isn't built to come back: steep welcome discounts, hero SKUs optimized for CPA, lifecycle programs designed around order 1. Acquisition meets its targets. Retention inherits the consequences.
This guide unpacks what the Order 2–4 cliff actually is, where it comes from, and why most brands can't see it in their own data. It walks through the questions your finance team should be asking but isn't, the diagnostic moves that expose the curve in your cohort tables, and the five interventions we deploy to bend it. It closes on why in-house lifecycle teams rarely close the gap on their own, even with the right diagnosis and plays in hand.
If your cohort curves are quietly drifting from your LTV model, this guide is for you.
What a Cohort-Level Interrogation Actually Reveals
The CFO conversation every CMO is having in 2026 starts the same way: "Defend marketing spend on an incremental basis." Most CMOs walk in with a blended LTV number and a confident CAC payback story — neither of which survives a cohort-level interrogation. The numbers feel solid in the deck and dissolve under the first follow-up question.
Here's what a cohort-level interrogation actually exposes.
Take a representative mid-market cohort:
Input | Value |
|---|---|
Cohort size | 10,000 new customers/month |
AOV | $75 |
Gross margin | 60% |
CAC | $60 |
Blended retention curve | ~4 orders per customer |
That blended average hides a cliff. The actual customer file has two populations: those who make it past order 3 (averaging 6+ orders, driving most contribution margin) and those who stall between orders 2 and 4 (averaging 1.5–2 orders, often never paying back the $60 CAC). The blended LTV averages these together, flattering the deck while missing what's actually happening in the file.
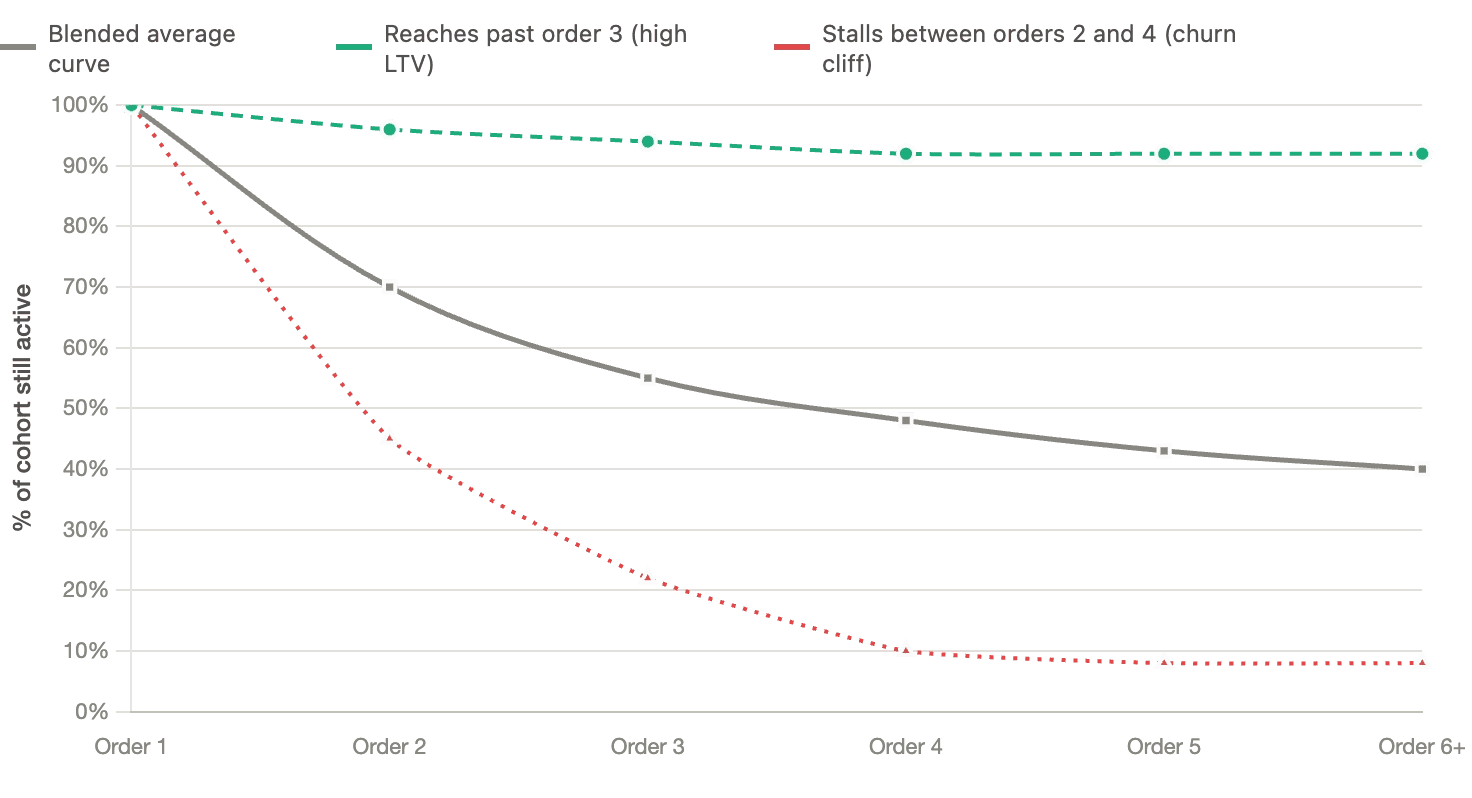
Visual: cohort curve showing the blended average vs. the real two-population reality
Now model what bending the curve does to that same 10,000-customer cohort. A 5–15 point lift in orders 2–4 retention shifts more customers into the "past order 3" population. Same CAC. Same acquisition team. Same first-order economics. The whole improvement lives downstream:
Per single 10,000-customer cohort | Baseline | +5 pts | +10 pts | +15 pts |
|---|---|---|---|---|
LTV per customer | $300 | $322 | $333 | $345 |
Gross profit per customer (60% GM) | $180 | $193 | $200 | $207 |
Net profit per customer (after $60 CAC) | $120 | $133 | $140 | $147 |
Total cohort profit | $1,200,000 | $1,330,000 | $1,400,000 | $1,470,000 |
Incremental cohort profit | — | +$130K | +$200K | +$270K |
Profit runs ahead of LTV. A $22 LTV lift is ~7% above baseline, but because CAC is fixed at the moment of acquisition, that same lift translates into an ~11% increase in net profit per customer. The incremental revenue arrives at near-pure contribution margin: no acquisition cost to amortize, often no first-order discount. The disproportionate profit impact is the whole point of bending the curve.
The 5–15 point lift the model illustrates is directional. The exact leverage point varies by business, which is why the diagnostic questions in the next section matter. But the underlying pattern holds: modest improvements in orders 2–4 retention compound disproportionately into profit.
At scale, this compounds quickly. At 10,000 new customers per month, the per-cohort gain compounds across 12 cohorts per year: $1.6M–$3.2M in incremental annual contribution margin, all from improving retention in the right order window. And because the underlying improvement is unit-economic, a 5–15 point lift typically compresses CAC payback by 30–50% — which is the number that unlocks more aggressive acquisition spend.
The CAC is unchanged. The acquisition team is doing the same job. The whole improvement lives downstream of the curve.
Why Acquisition's Wins Become Retention's Losses
The Order 2–4 cliff doesn't start at order 2. It starts the moment a customer enters the funnel. Most brands run acquisition and retention as separate disciplines with separate goals — and the way acquisition wins is exactly what makes retention impossible.
The customer who converted on a 40% off welcome offer didn't sign up to be a customer. They signed up to take a discount. The next offer — a subscription billing at the standing 10–15% off, or a value-size refill — doesn't feel like a benefit. It feels like a downgrade. The full-price value of the product never anchors in their head; the only number they internalized was the one on the welcome banner. Many never make a second purchase: subscribers cancel after the first delivery, and one-time buyers simply don't return.
There's a parallel problem on the product side: whether the first delivery earns a place in the customer's routine. Most don't. They use it once, leave it on the counter, and forget. Quality issues a longtime user would surface, like failing packaging, fading scent, or underperformance, never reach customer service or reviews. The brand never finds out.
Underneath both is a deeper misalignment: many brands run acquisition off the products with the lowest LTV and reorder rates. The hero SKU in the paid ad is often the worst possible customer entry point because it doesn't drive repeat behavior. Acquisition hits its CPA target. Retention inherits a customer who was never going to come back.
The hardest question — and the one most teams can't answer — is whether they actually know why their customers aren't coming back. Until acquisition is measured on cohort LTV and retention has a voice in product and offer strategy, the funnel keeps producing customers the rest of the business can't keep.
Where the Real Diagnosis Lives: The Data Hiding Between Your Platforms
Most brands try to diagnose the Order 2–4 cliff inside a single platform. Shopify shows orders. Klaviyo shows lifecycle performance. Your subscription platform shows subscription cohort curves. Each tool tells a partial story — and the cliff lives in the intersections.
The questions that actually expose the curve aren't being asked because no single dashboard can answer them:
Is your cohort curve measured by order count — and does it match what your LTV model assumes?
A blended rate hides the cliff. When your model assumes a smooth retention curve and your real curve drops between orders 2 and 4, your acquisition spend is funding a business that doesn't exist on paper.
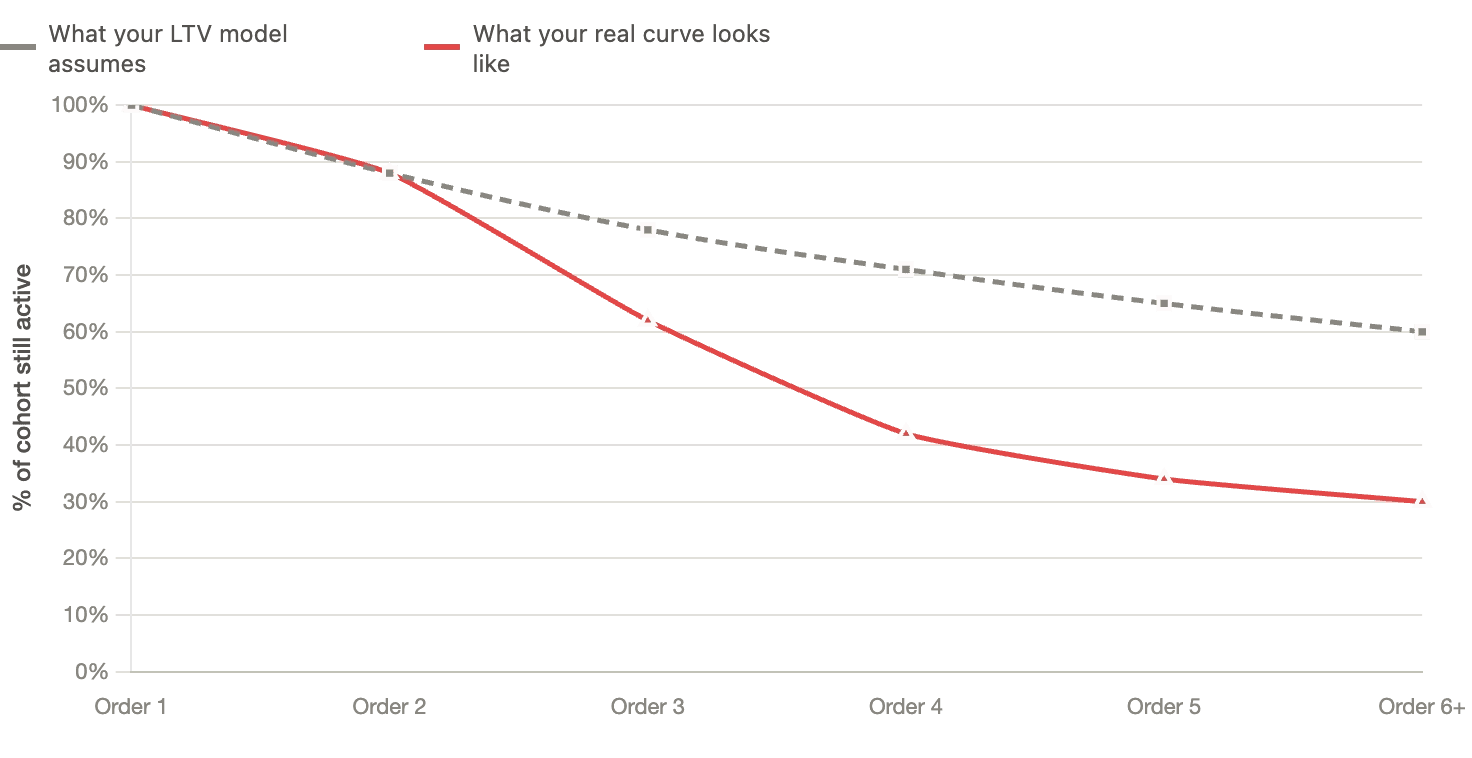
Visual: smooth retention curve vs. early cliff]
Which order transition is your biggest cliff — and what would a 5, 10, or 15 point lift there do to CAC payback and LTV:CAC?
Not all orders carry equal leverage. A 5-point lift at order 2 typically produces ~3x the profit impact of the same lift at order 4 — more customers in the earlier transition, wider value gap between "stopped" and "continued." Finding your cliff identifies where the lift matters most. Modeling its downstream impact on CAC payback and LTV:CAC is the number that unlocks aggressive acquisition spend. Most teams have never done either.
What share of total LTV is concentrated in customers who make it past order 3?
At most brands, the majority of cohort LTV sits with a minority of customers — and the gap between those who reach order 3 and those who don't is the most important number in the business that nobody has at hand.
What's your marginal contribution margin per additional order, by SKU and cohort?
Without this, every promotional decision is a guess — and the cumulative cost compounds against gross margin every quarter.
Does first-order discount depth correlate with order 2–4 dropoff — and what's discount dependency doing to contribution margin on repeat orders?
Brands leading with steep first-order discounts often train customers to wait for the next promo before reordering, capping the retention economics they're trying to build.
At Darkroom, our diagnostic process starts by connecting your website, ESP, subscription platform, and loyalty platform into a single cohort view — then layering acquisition channel, discount depth, and SKU mix on top. The cliff becomes visible when the platforms talk to each other, and the right interventions become obvious only after the diagnosis is in place.
Once you can see the cliff in your own data, the next question is what to do about it. The five interventions that follow are the ones we deploy to bend the curve.
Five Interventions That Bend the Retention Curve
The Order 2–4 cliff doesn't bend with one big bet. It bends through compounding interventions, each chipping points off the curve in a specific cohort. Below are five that produce consistent lift across our portfolio — and the details that separate what works from what just looks good in a slide deck.
1. Engineer your loyalty program around the cliff
A loyalty program is only as valuable as two things: where its rewards land in the journey, and how often you remind customers they exist.
Most programs get the first part wrong. Tiers tied to steep dollar thresholds push the meaningful reward moments out to month 6 or 12 — well past the cliff. However, tiers tied to purchase count, set at realistically achievable milestones — gold at 4 orders, platinum at 8 — land the biggest rewards exactly where the retention decision happens. The customer sees a tangible milestone within reach at order 2 and 3, and the program becomes a reason to keep going.
The second lever is constant visibility. Most brands mention the program once a quarter and assume customers remember. They don't. Your lifecycle stack should include welcome-to-loyalty flows, tier-progress notifications, "you just reached a new tier" triggers, expiring-credit warnings, and embedded balance reminders. Integrate a persistent notification bar at the top of every campaign send showing points balance, tier status, and what's next.
Your loyalty program should be a stream of personalized reasons to come back. Make sure customers understand what accumulated benefits they lose if they purchase elsewhere.
[Possible Visual: Customer Journey Map of City Beauty Loyalty program.]
2. Replace manual cross-sell with predictive cross-sell
The cross-sell module in most lifecycle emails was designed once, often more than a year ago, in a meeting where the team picked three products they thought made sense. It's been running unchanged ever since — through new product launches, discontinued SKUs, and shifts in customer purchase behavior nobody's been asked to revisit. The lift to redesign it is too high, so it sits. That's not strategy. It's a frozen guess that nobody's questioning.
[Possible visual: Klaviyo flow screen with last updated dated 14+ months ago]
Predictive cross-sell engines solve this. A model runs market-basket analysis across the full customer base and surfaces, for each customer, the three SKUs they're most likely to buy next — drawing from the live catalog and adjusting in real time as new products launch, old ones retire, and buying trends shift.
The team's job stops being "design the right cross-sell once and hope it ages well" and becomes maintaining clean product data so the model has something to work with. The module improves on its own — without a quarterly redesign cycle nobody has time to run.
3. Build two lifecycle programs, not one
Some categories don't have customers until the second purchase. Coffee pod systems, refillable premium skincare, razor cartridges, cleaning concentrates — businesses where the entire LTV equation lives in whether the customer comes back for the consumable. The most important segmentation in these brands isn't demographic. It's behavioral: has the customer bought the starter without buying the refill?
That single signal splits your file into two cohorts with completely different economics, completely different needs, and completely different paths back to repeat purchase. Treating them the same leaves the biggest LTV lever on the table.
Starter-but-no-refill | Refill loyalists | |
|---|---|---|
Behavioral signal | Bought the starter device or vessel, hasn't returned for the refill | Refill purchaser |
Risk profile | Highest churn-risk cohort | Highest-LTV cohort and most reliable source of repeat revenue |
Messaging objective | Activation and education | Convenience and reinforcement |
Example message | "Here's how to add this to your routine" | "We made it easier — refill in one tap" |
Timing trigger | Days after first purchase, before the churn window opens | Pulled from actual usage data — delivered just before the product runs out |
Refill campaigns consistently outperform when delivered just before the product runs out, not on a fixed monthly cadence. The data to time them is the prerequisite that compounds the lift.
4. Stop forcing subscription. Route each customer based on behavior.
Not every customer should be pushed to subscribe. For some the right next action is a reorder; for others it's the subscription. Brands that push subscription to everyone lose the customers who don't fit — and miss the reorder revenue they'd otherwise have captured.
The intervention is AI-powered decisioning. A machine learning model evaluates every customer in real time — purchase behavior, browsing signals, replenishment timing, and dozens of other variables simultaneously — and surfaces either a subscription or a reorder offer with the highest probability of conversion. The model learns from every interaction and gets sharper every week. No team running manual segmentation can match the speed or the precision. This is a decisioning problem, not a creative one.
Most teams stall here. The data exists, but it lives across the ESP, eCommerce platform, subscription layer, and analytics stack — none of which are talking to each other. The intervention is unblocked by integration, not by the idea.
5. Stop front-loading the subscription discount
Most subscription programs stack two discounts: a 30–50% one-time welcome offer to drive first orders, plus an ongoing 10–15% subscriber discount on every billing thereafter.
The problem isn't the standing 10–15% — it's the delta between the two. The customer who signed up for 40% off doesn't experience the 10–15% as a benefit; they experience it as a 25–30 point downgrade. Many cancel before the second box ever ships.
The test that consistently outperforms: taper the acquisition discount across the first 2–4 billings instead of collapsing it after order 1. A stepped structure — for example 30%, 25%, 20%, 15% across the first four orders before settling at the standing subscriber rate — typically out-earns a one-time 30–50% hit because it survives the re-evaluation window.
The prerequisite is margin discipline: before you redesign the offer, the team has to know — by SKU, by cohort — what they can actually afford to give. Most brands haven't done that math because nobody's asked them to.
None of these interventions are exotic. The reason most in-house teams don't run them is structural: a single retention manager can't produce the volume of segmented campaigns a precise lifecycle program demands, on top of the data-science work that cohort modeling, segmentation, and predictive routing require. That's the gap we close next.
Why Most In-House Lifecycle Teams Can't Solve This Alone
The Order 2–4 cliff isn't a campaign problem. It's a structural problem at the intersection of data, decisioning, and execution — which is exactly why in-house teams can't fix it alone.
The retention manager is consumed by the marketing calendar. The cohort-level diagnosis that would point at what to do is the work nobody has time for. Data lives across platforms that don't talk to each other. And executing it requires more segmented campaigns than one team can produce — to say nothing of the AI decisioning, predictive modeling, and data science work underneath.
This is what gets quietly underfunded at most brands. And the cost compounds. A buyer or board ultimately underwrites three numbers: retention, LTV:CAC, and growth quality. All three live downstream of the cliff. That is the work.
If your cohort curves don't match your LTV model, your CAC payback has drifted from reality, or your lifecycle is running on the marketing calendar instead of the customer one — we can help.
Darkroom Retention brings the data infrastructure, the capacity to scale segmented campaigns, and the full-service lifecycle execution most in-house teams can't sustain alone. Every engagement starts with a diagnostic audit on your own cohort data — and continues with the ongoing optimization that bends the curve over time.
Get in touch. The cliff doesn't fix itself.