Social Commerce
TikTok Ads Conversion Rate: The 10 Signs Yours Is Healthy and How to Achieve




Written by Darkroom leardership
10 min read
Sep 1, 2026

Your founder wants to know how TikTok is performing. You check Ads Manager and see the conversion rate at the top: 1.4%. But is this number actually good?
You can’t answer that, and even the first page of Google won’t help, since most benchmarks out there were never really measured.
The real answer depends on what you’re selling. For example, apparel brands see conversion rates more than twice those of health and wellness brands, even on the same platform in the same year. So, one number can’t mean the same thing for a supplement brand and a denim brand. Up next, you’ll find real category data, ten signs your campaigns are working, and four common reasons they might not be.
What is a good TikTok conversion rate in 2026?
A solid TikTok conversion rate is at or above your category’s average. Across all brands, the blended rate is 1.56%. This number comes from Triple Whale’s data, which covers over 5,900 ecommerce brands from August 2025 to July 2026 and was updated on August 20, 2026.
The same data shows a blended click-through rate (CTR) of 0.61%, a cost per mille (CPM) of $4.08, a cost per acquisition (CPA) of $17.07, a return on ad spend (ROAS) of 1.51, and an average order value (AOV).
However, the blended conversion rate dropped by 36.79% year over year, going from 2.46% to 1.56%. CPA also fell by 31.36% and CPM by 24.48% in the same period, so rising costs are not the issue. Instead, clicks have become less effective. efficient.
This means that any benchmark from before mid-2025 reflects a market that has changed. If you compare your 2026 results to those older numbers, even strong campaigns might seem like they are underperforming.
TikTok ads conversion rate by category
The median for your category is the most useful benchmark. The difference between categories is bigger than most would accept within a single account. For example, apparel averages 2.08%, while health and wellness averages 0.80%.
In the table below, these TikTok ad benchmarks are broken down by category, and the data also comes from Triple Whale. All results are platform-attributed.
Category | Conversion rate | CPA | ROAS |
|---|---|---|---|
Apparel & accessories | 2.08% | $20.64 | 2.70 |
Lifestyle & boutique | 2.06% | $19.59 | 2.00 |
Toys, art & collectibles | 1.71% | $18.37 | 1.57 |
Home & garden | 1.61% | $19.33 | 2.02 |
Electronics | 1.46% | $28.90 | 1.98 |
Beauty | 1.12% | $10.32 | 0.46 |
Food & beverage | 0.99% | $12.44 | 0.33 |
Sports & outdoors | 0.99% | $14.67 | 1.44 |
Health & wellness | 0.80% | $11.17 | 0.42 |
All industries blended | 1.56% | $17.07 | 1.51 |
What is the average TikTok conversion rate not showing you? There are two main things.
First, CPA and conversion rate do not always change together. For example, beauty products have a lower-than-average conversion rate, but their CPA is the lowest because a $29 order is much cheaper than a $71 electronics order.
Second, ROAS for TikTok ads shows a different pattern than conversion rate. Beauty, food and beverage, and health and wellness all have a ROAS below 0.5, even though their conversion rates are decent. This means their main challenge is basket size, not convincing people to buy.
CPM stays almost the same, ranging from $3.46 to $4.61 across the table. This means CPM is rarely the reason for conversion issues. If you are more interested in costs than conversion, there is information about TikTok ad cost in 2026 that covers this topic.
What counts as a conversion on TikTok?
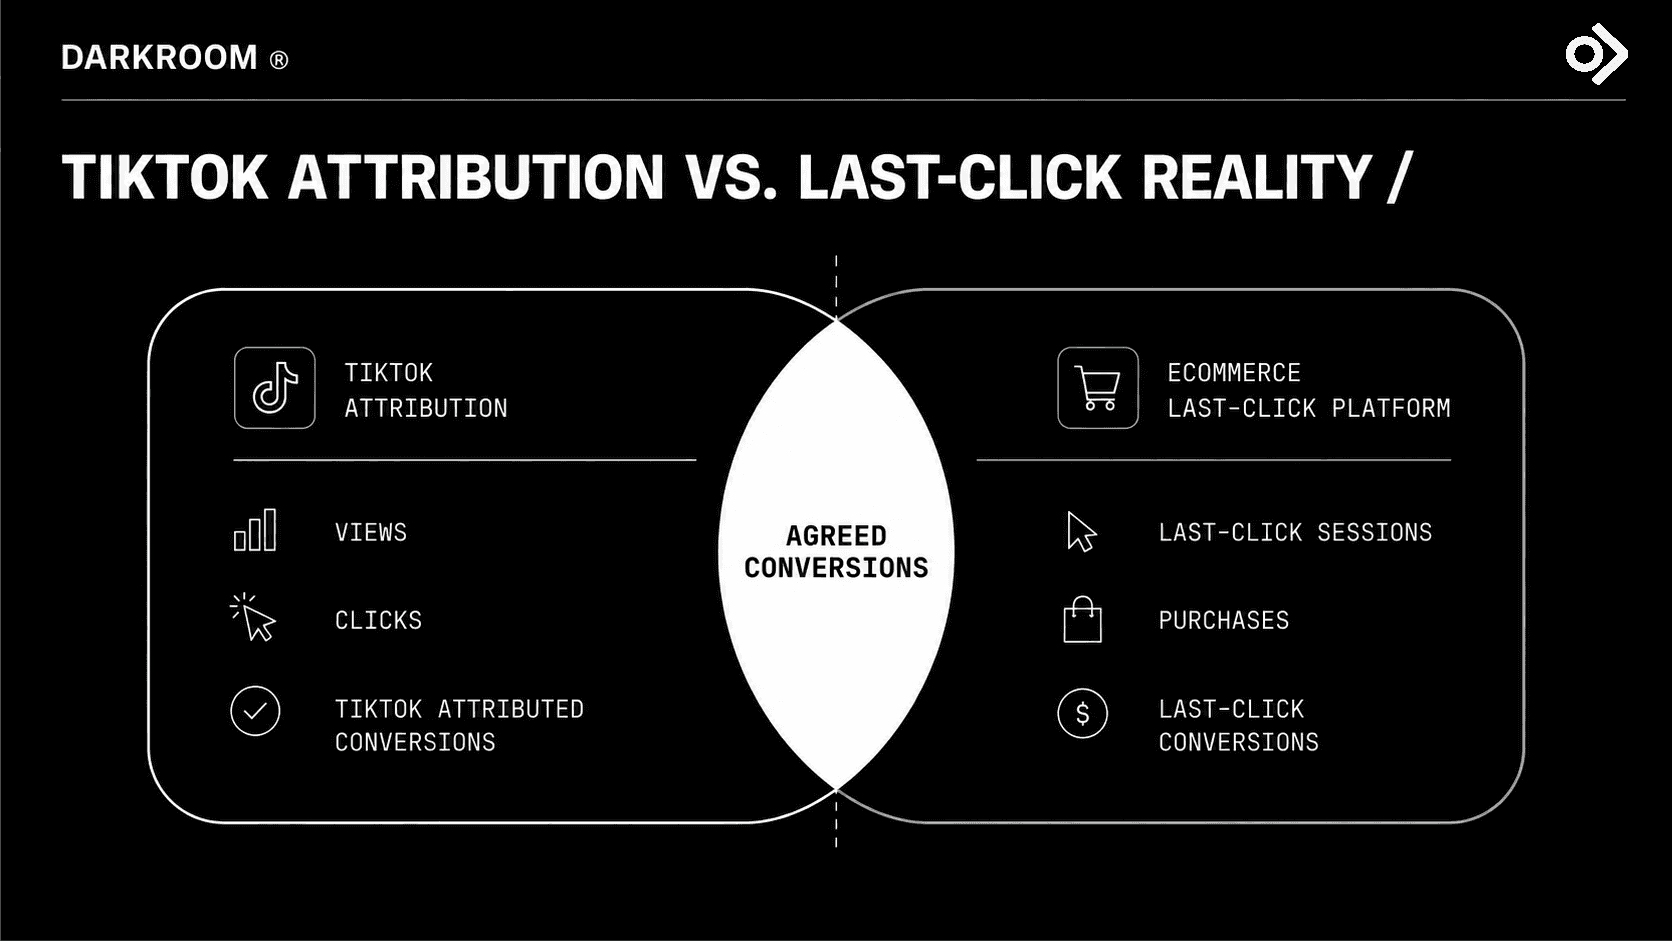
A TikTok conversion refers to the attributions that TikTok makes regarding your ad within the attribution period that you selected, and this does not coincide with the set of orders that your e-commerce platform assigns to TikTok. It is this discrepancy that causes most of the disagreements between your media and finance teams about whether the channel is effective.
The formula itself is simple enough:
TikTok conversion rate = (conversions ÷ ad interactions) × 100
The numerator is not simple. TikTok provides several selectable attribution periods but never specifies a default; in fact, its own help pages differ on the available options.
The page for ad group attribution settings, updated in November 2025, provides options for click-through at 1, 7, 14, or 28 days and for view-through at off, 1, or 7 days. The earlier version of the attribution window page, last updated in February 2025, had click-through set to 1 or 7 days and view-through set to off or 1 day. There is no default setting on either page.
The gap is due to a structural reason and not a reporting error; at the same level of spending, a conversion rate attributed to the platform counts more people than one based on the last click, since it includes view-through conversions and a longer lookback period.
The 10 signs your TikTok ads are converting
TikTok ad metrics and benchmarks for each:
The sign | The metric | Measure it against |
|---|---|---|
Conversion rate at or above category | Conversion rate | Your category row above (Triple Whale, Aug 2025 to Jul 2026) |
CPA inside the category band | Cost per acquisition | $10.32 to $28.90 across categories (same panel) |
ROAS at or above category | Return on ad spend | 0.33 to 2.70 across categories (same panel) |
CTR in the expected band | Click-through rate | 0.61% blended (same panel) |
Cart completion near the ecommerce norm | Add-to-cart to purchase | ~29.8% completion, implied by Baymard's 70.22% abandonment average across 50 studies |
Incremental, not merely attributed | Experiment-verified lift | Haus: 68% additional post-window lift, 62% of lift from new customers |
Stable rate on a conversion-count window | Conversion rate volatility | No published benchmark. Your own rolling window |
Creative still improving, not decaying | Cohort performance over time | No published benchmark. Your own prior period |
Creative volume sustained | Creatives per ad group | TikTok's recommendation of 3 to 5, not measured data |
Budget clear of platform minimums | Daily budget | TikTok's published minimums: $50 campaign, $20 ad group |
Sign 1: Your conversion rate is at or above your category median
Begin with this step, since it’s what your founder wants to know. Check your conversion rate, look up your category in the table above, and compare the numbers. Apparel brands should reach 2.08%. Beauty should reach 1.12%. Health and wellness should reach 0.80%.
If your rate is below your category’s median, that’s a real issue to address. If you’re at the median, you’re in a normal spot, so focus on improving one area instead of trying to fix everything.
If your rate is below the overall 1.56% but above your category’s median, that’s not a problem. That’s typical for a healthy beauty brand.
Sign 2: Your TikTok ads CPA sits inside the category band
The conversion rate alone will mislead you since categories with small baskets have a low conversion rate. It is the cost per acquisition that reflects this.
The CPA ranges from $10.32 for beauty to $28.90 for electronics, compared to a blended figure of $17.07. This represents almost a threefold difference and is much more closely related to the average order value than to skill.
A CPA of $26 in the field of electronics is nothing special; but when you have $26 in beauty, you're paying about 2.5 times the normal amount for the category to get a $29 order, and no creative refresh can remedy that. Once that situation arises, it becomes a matter of pricing and margins, not one of media.
Sign 3: Your TikTok ads ROAS clears your category, not the blended line
ROAS is where things get tricky in this table. It ranges from 0.33 for food and beverage to 2.70 for apparel, which is more than an eightfold difference.
So, if your food and beverage brand has a 0.6 ROAS, you’re almost doubling the category average but still not making money on the first sale. If this sounds familiar, TikTok isn’t the problem. Your business just needs customers to buy again for the numbers to work, so focus on lifetime value instead of just campaign ROAS.
Read also: A Complete Guide To ROAS Calculation to measure your Ads performance
Sign 4: Your TikTok ads CTR is inside the expected band
The blended click-through rate for this panel is 0.61%, representing a year-on-year decrease of 12.5%. In fact, for this particular benchmark, close is as good as close can be.
A CTR of 0.55 percent compared to 0.61 percent amounts to nothing more than a rounding error and will result in more creative churn than you can ever recover if you pursue it.
What is important in this case is direction, not distance. If the CTR remains the same but the conversion rate drops, it means people still want to click, but something goes wrong after the click. If the CTR is falling while impressions stay level, then it is the creative that has stopped working, which is sign 8.
Sign 5: Your cart completion is near the ecommerce norm
Improving cart completion is the easiest and most cost-effective win here, and it isn’t related to TikTok. The Baymard Institute found that the average cart abandonment rate is 70.22%, based on 50 studies from 2006 to 2025. That means only about 29.8% of carts are completed.
Baymard also estimates that a large e-commerce site could see 35.26% more conversions just by improving its checkout design. This is based on ten years of testing with major retailers in the US and EU.
So if your add-to-cart volume looks fine and your purchases don't, stop staring at the ad account. You're paying TikTok prices to fill your cart, only for it to empty at checkout.
Sign 6: The lift is real, not just reported
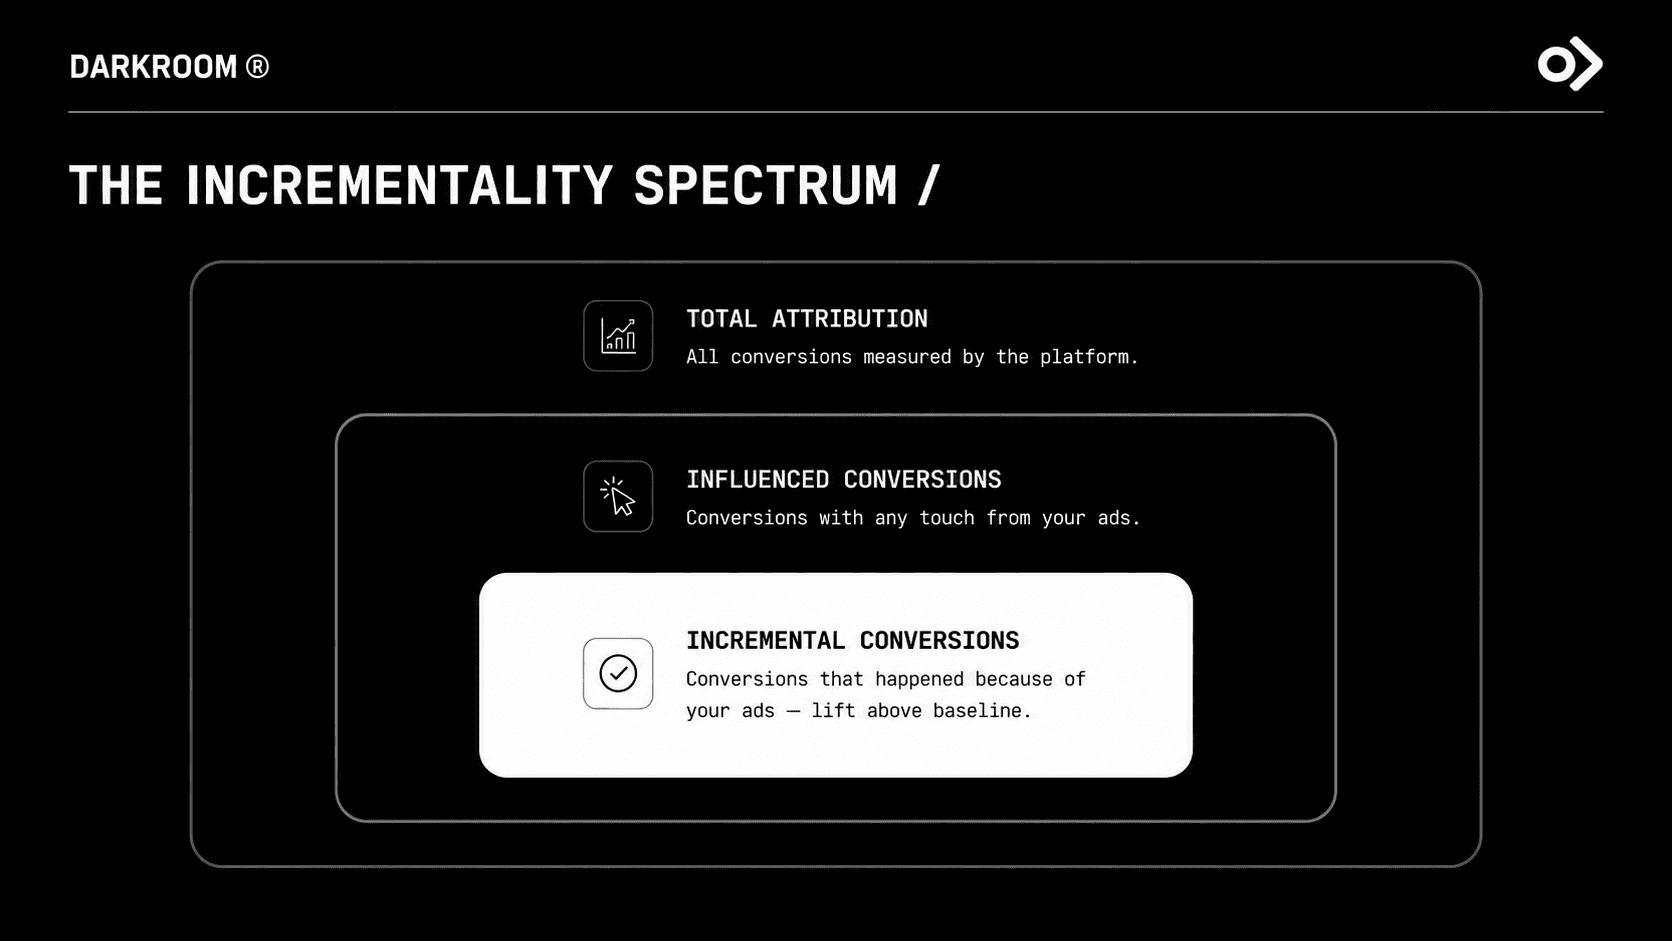
In December 2025, Haus, an independent measurement company, released findings from hundreds of its own randomized experiments, each lasting an average of 21 days with a 9-day post-treatment period, involving advertisers who spent nearly $3 million each year on TikTok.
Brands achieved an additional 68% improvement in their main KPI during that period following treatment, a boost that appeared after most measurements had ceased. Sixty-two per cent of TikTok's increase was due to new customers.
TikTok delivered 1.9 times the value in omnichannel impact compared with direct-to-consumer lift alone, with 34% of sales, on average, going to Amazon and 57% to physical retail.
If there's a discrepancy between your platform number and your blended number, don't just take the average; use incrementality testing to determine which one is incorrect.
Sign 7: Your rate is stable on a conversion count
There isn’t a standard benchmark for conversion rate volatility, so it’s best to track your own numbers and use a time frame that makes sense for your business.
If your business brings in $20,000 a month with an average order value of $50, you’ll get about twelve conversions each day. With numbers that small, just three more or fewer conversions can change your daily rate by 25%, but that shift doesn’t actually mean anything important.
Instead of comparing yesterday to the day before, look at your results over a longer period to get a more stable number of conversions. Many accounts only seem volatile because they’re checked too often, and making quick changes out of panic usually causes more harm than the problem you thought you saw.
Sign 8: Your creative is still improving
TikTok has never published a fatigue threshold, and all the seven-day refresh rules you've come across can be traced to individual blog posts, since TikTok's own information on usage frequency contains no quantitative statement.
Compare each creative cohort with the performance of that same cohort during its very first week. If the conversion rate drops while the number of impressions remains unchanged, then the campaign is wearing out, and you'll be able to detect this during that first week before it ever affects ROAS—indeed, that is precisely why you're supposed to be looking at it.
Read also: The Performance Creative Testing Framework for 2026
Sign 9: You're feeding each ad group enough creative to learn from
TikTok’s creative best practices suggest using 3 to 5 creatives per ad group and 3 to 5 ad groups per campaign. They also recommend putting your hook in the first 6 seconds and your main message in the first 3. Keep in mind, though, that this is just guidance.
Think of these numbers as a minimum, not a goal. If you only run one creative in an ad group, you won’t know if poor results are due to the creative or the audience, since you have nothing to compare.
With two creatives, you can compare results. With five, you start to see trends. At this stage, having enough options matters more than perfecting each one.
Sign 10: Your budget clears the platform minimums with room to spare
According to TikTok's budget documentation, updated in July 2026, the minimum amounts are $50 at the campaign level and $20 at the ad group level. Once again, these are minimum requirements set by the platform, not optimization thresholds, and the difference is more significant than it may appear.
When you run ads at the floor level, all the ad groups are competing for a small number of conversions, and the algorithm is never given a clear signal as to which one should get the money; this manifests as volatility and will take you directly to sign 7.
The $100-a-day rule that you've probably heard quoted there? In fact, there is no published source, which is why it isn't included in this article.
What TikTok ads best practices actually move conversion rate?
The TikTok ad best practices that genuinely drive conversion rates are the ones backed by a mechanism, and there are far fewer than the listicles suggest. Four are worth your week.
Feed the ad groups properly: TikTok's 3-to-5-creatives guidance exists because thin ad groups crawl out of the learning phase and never build a comparable sample. It's a volume problem before it's a quality problem.
Build creative that survives three seconds: The format that sustains this at volume is creator-led rather than studio-led, which is why user-generated creative on paid social keeps beating polished assets in feed.
Fix measurement before media: Pick one attribution window and leave it alone. A campaign compared across two window settings isn't being compared at all.
Give the algorithm room above the floor: The platform's minimum budget leaves nothing for the learning phase.
Darkroom is a TikTok Shop agency and social commerce team, and we run paid, creator, and marketplace programs as one system for direct-to-consumer brands.
Fix the metric that is actually broken
Ten signs, and most accounts are failing exactly one of them. Knowing the difference between a creative sprint that works and a quarter spent refreshing assets while the real leak sits in your checkout or your attribution window.
So which of the ten is yours? Darkroom runs TikTok ads, creator programs, and TikTok Shop as one system, measured through Shadow, our proprietary AI commerce layer. If your conversion rate is below your category average and you're not sure why, book a call with the TikTok Shop team and we'll explain.