GROWTH STRATEGY
Brand vs Performance Marketing: A Split Most Brands Never Made




Written by Darkroom leardership
9 min read
September 18, 2026

Brand vs. performance marketing is a split in how spend is measured, not in how people buy. Performance captures demand that brand created, so cutting the brand line lowers reported CAC first and raises real CAC later, once the demand it was harvesting runs out.
Nobody ever decided to buy something because of a campaign's budget line. The split is real inside your reporting and almost nowhere else. This piece covers where it came from, what the evidence says it costs, and how to allocate across both.
Key takeaways
The split tracks measurability, not value. Analytic Partners finds last-click metrics overstate clickable activity by 2 to 10x.
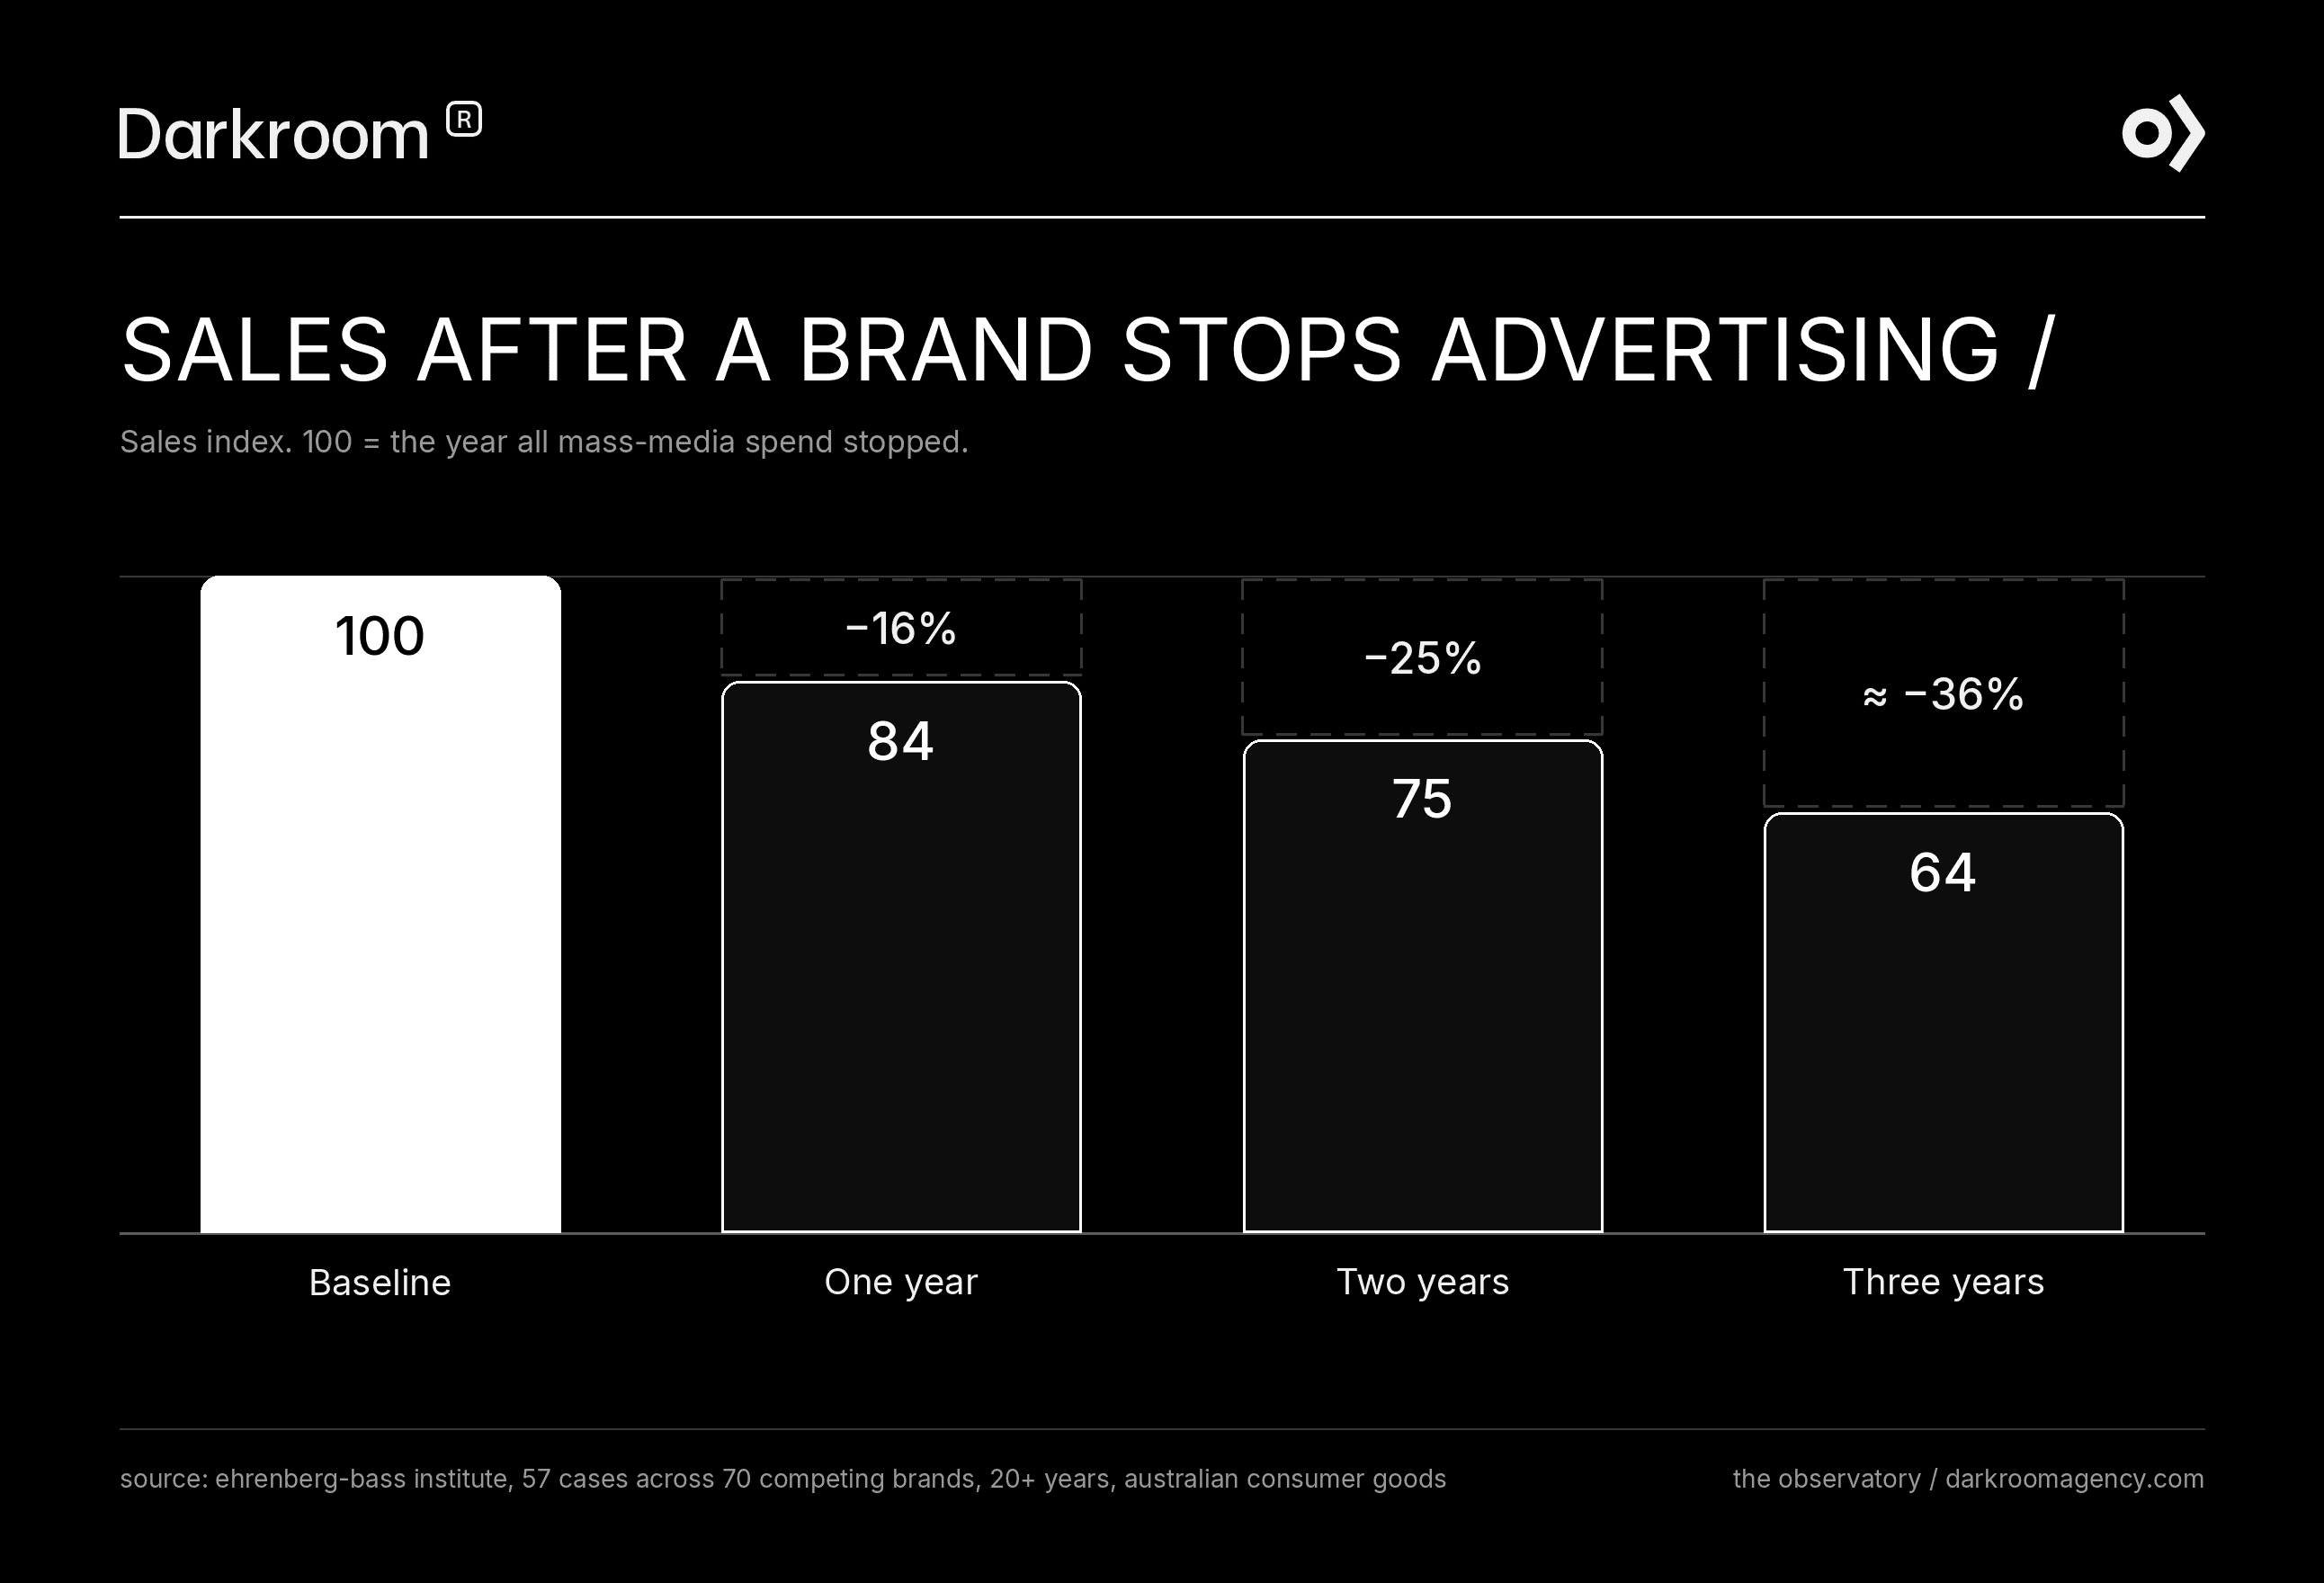
Cutting brand improves CAC before it damages it. Sales fell 16% after one year and roughly 36% after three across 57 brands that stopped advertising.
The trade-off is not symmetrical. 92.1% of ads built for long-term brand building also beat the short-term average. The reverse is close to a coin flip.
Budgets say one thing, the newest data says another. 42% of marketers favor performance when budgets fall, but UK video spend has just been revised to a two-year high.
No benchmark describes your business. Published ratios are starting points. Only a holdout test tells you your number.
What is brand vs performance marketing?
Brand marketing builds future demand. Performance marketing converts demand that already exists. Both are advertising, both cost money, and they are managed as separate disciplines because one reports back within a quarter and the other doesn't.
What is brand marketing?
Brand marketing is investment in memory. The job is to make a brand come to mind in a buying situation the advertiser did not create and cannot see, which is most of them. When someone opens a marketplace app with a brand already in mind, that predisposition was bought earlier, by work that never got credit for the sale.
That is also the measurement problem. The return arrives outside the window most teams report in, which makes brand the easiest line to defend on theory and the hardest on a spreadsheet.
Key brand marketing strategies
Build a consistent creative platform. Reuse distinctive assets long enough to accumulate, not refresh them every quarter because the team got bored before the market did.
Buy reach against category buyers, not just in-market ones. Most of the category is not shopping today. That is the audience brand spend exists for.
Measure on lift and share, not last click. If attributed conversions are the only available metric, brand work will always look like it failed.
What is performance marketing?
Performance marketing buys measurable response inside a defined window. Paid search, paid social, affiliate, retargeting, anything where a conversion ties back to an impression and can be optimized against. It is good at what it does: it finds people already looking, and it tells you within days whether it worked.
It is also often confused with growth marketing, a different discipline. How growth marketing differs from performance marketing covers that distinction, which is about which capability you are buying rather than how the budget divides.
Key performance marketing strategies
Optimize the auction and the offer, not just the audience. Targeting is largely automated now. Bid strategy, creative, and offer are what is left to control.
Test creative at volume. The win rate on variations is low enough that throughput, not taste, decides the outcome.
Validate the dashboard against a holdout. Platform-reported results and incremental results are different numbers. Only one of them is money.
Why does the split exist in your dashboard and not in your market?
Because one is easy to attribute and the other isn't, and budgets follow attribution.
Analytic Partners has run this across more than 750 brands in 45 countries and hundreds of billions in spend. Its finding: last-click metrics "overstate the role of clickable activities by 2-10x, on average." A further 30 to 60% of outcomes come from non-marketing factors like seasonality and category trends, which attribution silently assigns to whatever was clicked last.
That is a measurement firm saying the measurement is wrong by up to an order of magnitude.
The pattern holds in experimental data. Haus published results from 640 Meta incrementality experiments run since the start of 2024, across advertisers spending an average of $14M a year on the platform. The incrementality factor rises as you move up the funnel: 1.3x at mid-funnel, 2.4x on traffic, and 6.0x on reach and awareness, measured against lower-funnel optimization.
Read that as a rule. The further a tactic sits from the click, the more of its real effect the platform fails to see. So a budget split built on reported performance is not a split between what works and what does not. It is a split between what counts easily and what does not, and those are different things. Incrementality testing and media mix modeling exist because of this gap.
Read also: Marketing Efficiency Ratio - One P&L, Three Ways to Read It
What happens to CAC when you cut the brand line?
It improves. That is the problem.
When brand spend stops, the harvesting layer keeps running against a demand pool nobody is refilling. Same conversions, less total spend, better reported efficiency. The gain is real in the dashboard and temporary in the market.
The Ehrenberg-Bass Institute measured the shape of what follows. Across 57 cases of brands that cut all mass media spending for a year or longer, tracked among 70 competing brands over more than 20 years in Australian consumer goods, sales fell 16% after one year, 25% after two, and roughly 36% after three.
The nuance explains why the decision keeps getting made. Smaller brands declined faster than medium brands, and medium brands faster than large. More pointedly, every previously growing large and medium brand "continued to grow for 1-2 years after stopping," while previously growing small brands fell below their base sales almost immediately.
So for most brands with scale, the cut looks correct for one to two years. Budget cycles do not run that long. A wrong cut and a right cut are indistinguishable for exactly as long as anyone is measuring, which is why this decision survives contact with data that should kill it.
Meanwhile, the harvesting layer is getting more expensive. Meta reported that average price per ad increased 12% year over year in Q2 2026, the second consecutive quarter at that rate, with impressions also growing.
Unit costs are rising in the channel most performance budgets sit in, while the dashboard overstates what those units deliver. Both ends of blended efficiency move against you, slowly, and neither shows up as a line item.
Read also: Why Paid Media Fails When You Optimize for Platform Metrics
Does brand building cost you short-term sales?
Usually not. Creative built for long-term brand building tends to deliver short-term results as well, while creative built only for short-term response often fails in the long term. The trade-off most marketers believe they are making runs mostly in one direction.
System1 pre-tested more than 40,000 US TV ads between June 2018 and May 2024, scoring each on two scales: a Star Rating for long-term brand building and a Spike Rating for short-term sales. Here is how each group performed on the opposite measure.
Ads built for | What happened on the other horizon |
|---|---|
Long-term brand building (4 to 5 Stars) | 92.1% also scored above average on short-term sales potential |
Short-term sales (top 25% by Spike Rating) | 53.4% scored in the bottom two Star bands for long-term brand building |
Source: System1, more than 40,000 US TV ads pre-tested June 2018 to May 2024.
One scope caveat that matters: this is emotional pre-testing of creative, not a media-mix or budget-allocation study. It tells you what happens inside the work, not how to split a budget.
That is still the more useful finding. When a team cuts brand work to protect the quarter, the short-term number it is protecting was, in most cases, never at risk from that work.
How should you divide the budget between performance and brand?
When it comes to brand building and performance marketing, most people want to know how much to invest in each. It usually comes down to finding the right split between the two. Here’s a simple way to figure out what ratio might work best for you:
Start by picking a ratio to test: Use industry benchmarks as a starting point. For example, Analytic Partners found that brand marketing actually outperforms performance marketing 80% of the time. They also found that upper-funnel tactics are 60% more effective over the long term, and only 25% less effective in the short term.
Check if your brand and performance marketing efforts are truly independent: Analytic Partners found that about 30% of paid search results are actually driven by brand and upper-funnel activity. In other words, some of the results you see in search are thanks to your brand campaigns. So, you can’t just treat these as totally separate buckets.
Test your ratio in the real world: One way to do this is by running a geo holdout test. This means trying different allocations in different regions and seeing what works for your business. Use benchmarks to get started, but let your own results guide your final decision.
Focus on contribution margin, not just channel ROAS: This one can be misleading because it often favors the channels that are easiest to track, not necessarily the ones driving the most value. Contribution margin gives you a more honest picture of what’s really working. Plus, by connecting your brand and performance efforts into a full-funnel system, you’ll avoid starting from scratch every quarter.
The next challenge is figuring out if you can create ads that do both jobs at once: building your brand and driving performance. This is where your creative team really comes into play, since performance creative often becomes the bottleneck.
Is the market already correcting?
This article suggests that brand spending is often the first to be reduced. The evidence is mixed, and the latest data does not support our position.
On one side, WARC's Voice of the Marketer surveyed over 1,000 marketers worldwide in late 2025. Among those expecting smaller budgets, 42% preferred performance marketing, while only 29% chose brand. The same study found that 55% saw short-term thinking as a major concern.
Meanwhile, the IPA Bellwether report for Q2 2026, released in July 2026, offers the latest budget data. Video spending increased by a net balance of +8.2%, which IPA Director General Paul Bainsfair called "its highest level in almost two years." In contrast, other online channels, which are used for shorter-term campaigns, were "cut for the first time in seven quarters" at −5.1% quarter-over-quarter.
These two datasets come from different places and times, and they show different trends. WARC reflects what marketers plan to do as they prepare for budget cuts, while Bellwether shows actual spending decisions in the UK six months later. It looks like the UK is adjusting first.
The Bellwether report does not share its panel size, which matters before relying on its findings. If this shift is real, brands that kept their budgets steady in 2025 may soon be the ones with demand to capture.
Build creative that does both jobs
The split is not a strategy problem. It is a production problem wearing a strategy costume.
Once you accept that brand work and performance work reach the same person through the same feed, the question stops being how to divide a budget and becomes whether your creative can carry a brand while clearing a cost per acquisition. Most cannot, because two teams briefed them against two scoreboards.
Darkroom is a performance creative agency built around that single scoreboard. Media and creative sit in one team, output runs at 250 to 600 production-ready assets per cycle, and Shadow, our AI commerce layer, connects what runs to what it earns. On Olipop, that produced a 3x return on ad spend and a click-through rate 28% above industry benchmarks.
If your brand line and your performance line are being judged by two different standards, talk to our performance creative team.
Frequently asked questions
What is the difference between brand and performance marketing?
Brand marketing builds future demand and reports back over years. Performance marketing converts existing demand and reports back in days. The practical difference is the measurement window, not the buyer, since the same person encounters both and does not experience them as separate categories of advertising.
Is performance marketing better than brand marketing?
No, and the evidence runs the other way. Analytic Partners finds brand marketing outperforms performance marketing 80% of the time across its database of 750-plus brands, with upper-funnel tactics 60% more effective long term and only 25% less effective short term. Performance simply reports faster.
What happens if you stop brand advertising?
Sales decline, with a lag. Ehrenberg-Bass tracked 57 brands that halted mass media spending for a year or more in Australian consumer goods: sales fell 16% after one year, 25% after two and roughly 36% after three. Large growing brands kept growing for one to two years first.
What is performance branding?
Performance branding is brand-building work executed through performance channels and held to a measurement standard, rather than exempted from one. It requires two things: creative that carries the brand at channel speed, and measurement that can see past the click. Without both, the brand half gets reported as waste.
How much of the budget should go to brand building?
The IPA's published guidance suggests roughly 60% brand to 40% activation. Analytic Partners recommends at least 50% to brand. Both are starting points drawn from other companies' databases. Run a geo holdout and let your own incrementality result replace the benchmark for your category.
Why does cutting brand spend make CAC look better at first?
Because performance spend keeps harvesting demand that brand already created. Remove the brand line and the same conversions arrive against a smaller total spend, so reported efficiency improves. The decline starts once the demand pool empties, which for larger brands takes one to two years.