
BUSINESS STRATEGY
Contribution Margin for Marketing: How Finance Judges Your Budget




Written by Darkroom leardership
Last update: August 10, 2026

Contribution margin is what remains from revenue after every variable cost of serving an order: cost of goods, fulfilment, shipping, payment fees and variable marketing. Fixed overhead sits below it. Finance uses it to judge marketing because it is the only margin that moves when marketing changes what it does.
The budget meeting has a familiar shape. Marketing arrives with return on ad spend (ROAS) and channel dashboards; the chief financial officer (CFO) is holding a profit and loss (P&L) statement, and the two sets of numbers never touch.
Marketing does not lose that argument because the work is bad. It loses because contribution margin is the one number that exists on both sides of the table, and only one side brought it. This guide covers the finance frame in the order the meeting runs: the metric, how finance evaluates spend, the margin bridge, the scenario plan, and exactly which artifacts to bring.
What is contribution margin, and why does finance use it to judge marketing?
Finance leans on contribution margin because it is the only margin marketing can actually move. Operating margin carries overhead marketing does not control; contribution isolates the part of the P&L a growth marketing plan actually touches. In consumer businesses, this is the layer people mean when they talk about unit economics.
The contribution margin formula: revenue minus cost of goods sold (COGS), fulfilment and freight, payment processing, and variable marketing spend. Divide the result by revenue and you have the contribution margin ratio, the percentage form finance underwrites.
Cost | Above or below the line? | Who controls it |
|---|---|---|
Cost of goods sold | Above | Supply chain and sourcing |
Freight and fulfilment | Above | Operations |
Payment processing | Above | Finance (rate), marketing (volume) |
Discounts and returns | Above | Marketing and merchandising |
Variable media and agency fees | Above | Marketing |
Salaries, rent, software | Below | The business |
The rule that settles most arguments: fixed overhead never sits above the contribution line. A salary does not become variable because the person works on ads. Darkroom, a growth marketing agency for consumer and enterprise brands, treats agreeing this variable cost list with finance as the first step of any budget conversation, because every later number stands on it.
Gross margin vs contribution margin: what is the difference?
Gross margin subtracts only the cost of goods sold; contribution margin subtracts every variable cost of serving the order. The gap between them is where ecommerce economics hide.
That gap is why the two teams quote different numbers from the same month. An order at 62% gross margin can turn contribution-negative once freight, payment fees and a 20% discount code are counted. A big-ticket furniture order with white-glove delivery can lose money at a gross margin an apparel brand would envy.
Four related terms show up in this conversation, and most budget arguments are two people using different ones without noticing:
Term | What it subtracts from revenue | Use it for |
|---|---|---|
Gross margin | Cost of goods sold only | Product and pricing decisions |
Contribution margin (%) | Every variable cost, including variable marketing | Underwriting the plan; the finance view |
Same costs, expressed in dollars | Weekly operating pace for the growth team | |
Contribution margin before variable marketing | Every variable cost except marketing | Testing what an added media dollar earns |
The formula is trivial. The variable cost list is the fight.
How does a CFO actually evaluate marketing spend?
Finance is not grading the campaign. It is asking four questions about the money, and every budget meeting is those four questions wearing different clothes.
Does the incremental dollar return more than it costs? Not the average dollar, the next one. Marginal return at the margin you actually earn, not blended history.
How fast does it pay back in cash? A plan can be profitable on paper and still strain working capital. Payback horizon matters more when customer lifetime value arrives over years rather than weeks.
Is the return caused, or just correlated? Attribution reports proximity. The strongest answer is to prove the spend is incremental with a controlled experiment rather than a model, and the weakest is a platform report grading its own homework.
What does it do to the rest of the plan? More spend changes inventory, cash timing and operations load. Finance reads the marketing P&L as one page of a bigger book.
This is the marketing finance frame in full, and it is learnable. A blended read like marketing efficiency ratio (MER) helps answer the first question. The question underneath all four is whether anyone agrees what the margin actually is, which is why a growth strategy diagnostic starts by establishing a contribution profit baseline, and why Darkroom evaluates performance on contribution margin analysis rather than platform-reported ROAS across its accounts.
What is a contribution margin bridge, and how do you build one?
A bridge explains the change in contribution between two periods as a series of named deltas, so the conversation moves from "margin is down" to "margin is down for four reasons, and marketing owns two of them." Finance teams build these routinely. Marketing teams rarely see one, which is exactly why bringing one changes the meeting.
Building one takes four steps, and none of them is modelling:
Pick two periods with comparable seasonality, usually this quarter against last.
Agree the variable cost list for both periods, so every delta is measured on the same definition.
Decompose the change by driver: volume, price and discount depth, cost of goods, acquisition cost, and customer mix.
Assign an owner to each driver, including the ones marketing does not own.
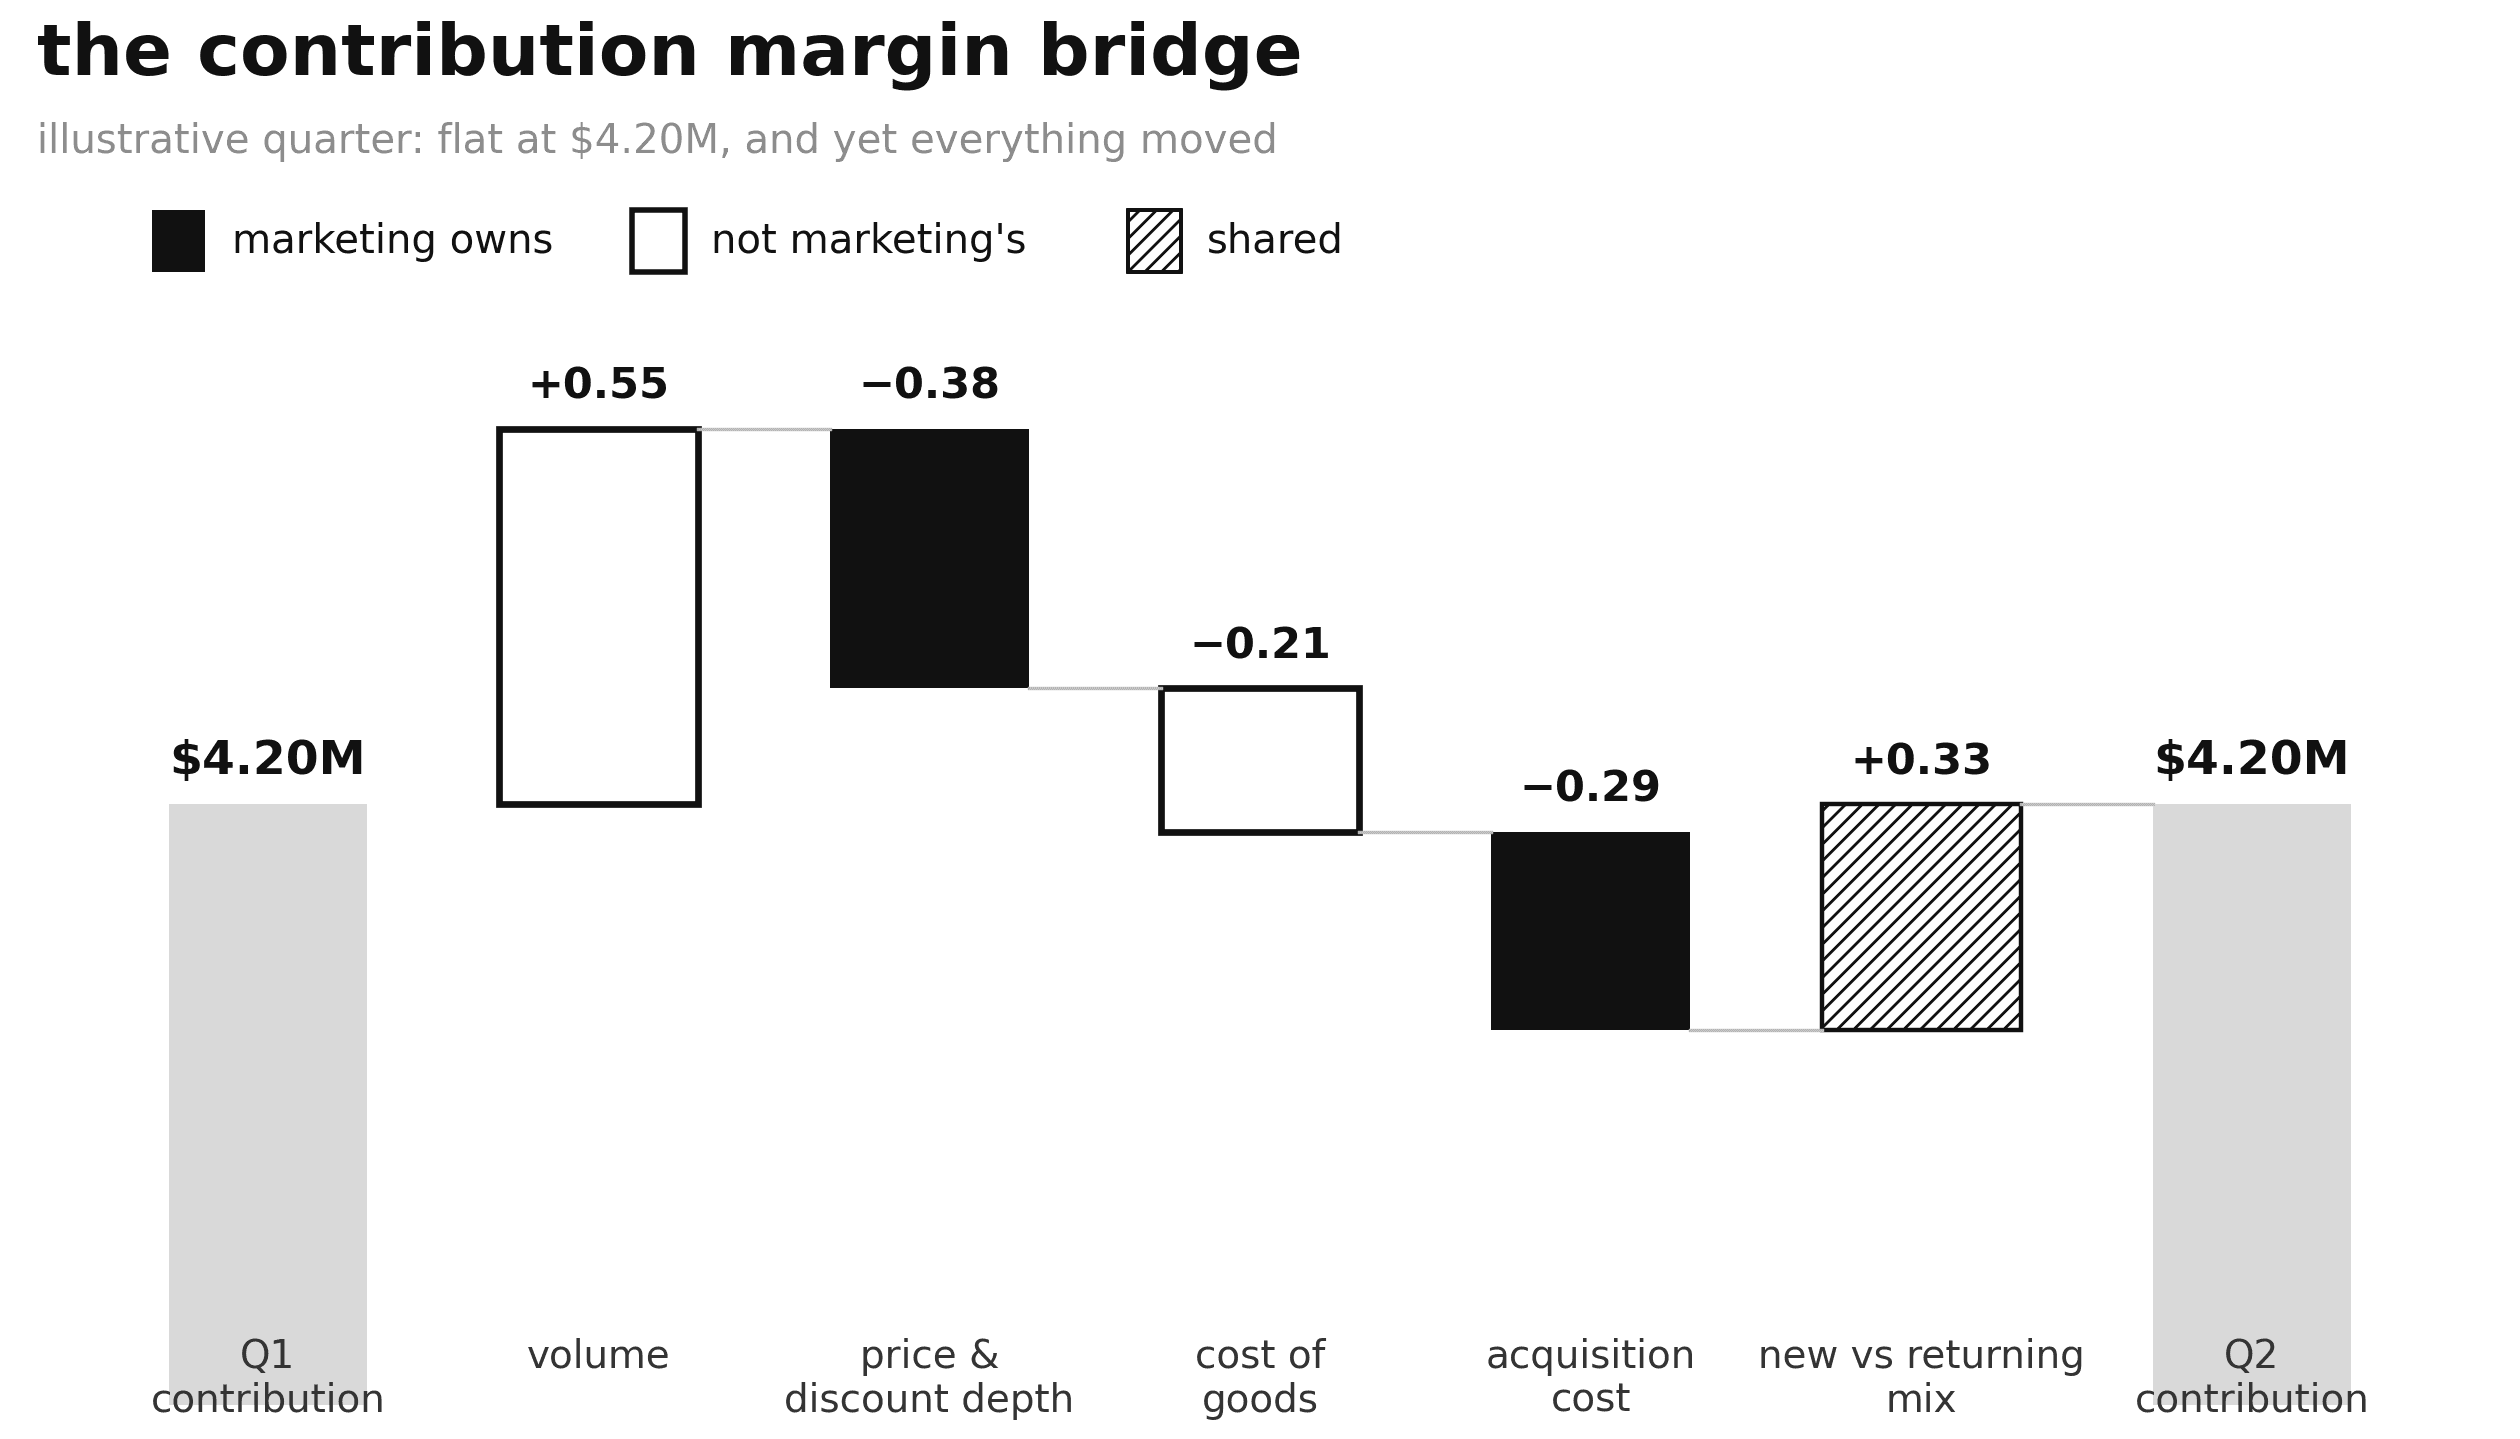
Here is an illustrative quarter for a nine-figure consumer brand, Q1 to Q2:
Starting contribution (Q1): $4.20M
Volume: +$0.55M (orders up on a stable baseline)
Price and discount depth: −$0.38M (a sitewide code ran four weeks longer than planned)
Cost of goods: −$0.21M (a freight surcharge landed mid-quarter)
Customer acquisition cost (CAC): −$0.29M (rising auction prices, unchanged creative)
New-versus-returning mix: +$0.33M (repeat orders carried no acquisition cost)
Closing contribution (Q2): $4.20M
Flat, and yet everything moved. That is the bridge's power: it converts a shrug into an agenda. Marketing owns the discount delta and the acquisition delta, shares the mix delta, and does not own the freight surcharge. Volunteering that boundary is what buys credibility for the deltas you do claim, and it connects directly to managing profit per visitor on site.
How do you build a scenario plan finance will accept?
Three scenarios, one page, every assumption named and sourced. Most scenario plans fail on the second half of that sentence: the assumptions are implicit and the downside case is missing.
One definition before the table. The scenarios below model on contribution margin before variable marketing, 42% in this example, because the added media spend is the variable being tested. Deducting marketing twice would understate every scenario.
Hold | Invest | Stretch | |
|---|---|---|---|
Annual media spend | $12.0M | $15.0M | $18.0M |
Incremental revenue vs hold | baseline | +$7.5M | +$13.2M |
Incremental contribution after added spend | baseline | +$0.15M | −$0.46M |
The assumption it rests on | Efficiency holds | New-customer CAC holds at current level | CAC improves; break-even needs $14.3M incremental revenue, 8% above forecast |
Illustrative figures; every plan should carry its own margin.
Three rules make a table like this credible. Model incremental margin on the incremental dollar, never average margin on total revenue. State the assumption you are least confident in rather than burying it. And give the downside the same rigour as the upside: the stretch column earns trust precisely because it shows the spend-destroying contribution at forecast efficiency.
Two additions finance will notice. The stretch cell carries the break-even analysis most plans skip: the revenue level where added spend stops paying. And cash flow timing belongs on the page, because a plan that is margin-accretive across the year and cash-negative in Q4 still gets rejected. Setting targets from these scenarios, rather than from last year's percentage, is the whole exercise.
Which levers actually move contribution margin?
Five levers, and they are not equally available. Ranking them by speed and trade-off is the most useful planning conversation a growth team can have with finance.
Price. Fastest arithmetic, real volume risk. A 3% price increase flows almost entirely to contribution if volume holds, which is the assumption to test rather than assume.
Cost of goods. The largest lever and the slowest: a supplier renegotiation takes quarters and belongs to operations, not marketing.
Freight and shipping subsidy. Immediate effect, direct conversion cost. Raising a free-shipping threshold trades margin for checkout completion.
Customer mix. Repeat orders arrive without acquisition spend, so a point of mix shift toward returning customers drops almost entirely to contribution, which is why returning revenue costs less to earn. That is arithmetic, not a benchmark: read your own multiple off your own cohort data.
Acquisition cost. At fixed spend and fixed price, performance creative efficiency is the fastest lever available: higher click-through and conversion lower CAC without touching goods, freight or price. Olipop's first national video campaign became the brand's top-performing ad content across channels, fueling 3x revenue growth and a 28% increase in broader audience reach. The caveat that keeps this honest: creative fatigue erodes the gain, so this lever is pulled continuously, not once.
Which artifacts should you bring to the budget meeting?
Four documents, none longer than a page, sent 24 hours before the meeting. Together they are the marketing business case; separately, each answers one of finance's four questions.
Artifact | What it answers | What goes on it | Who supplies the data |
|---|---|---|---|
The bridge | What happened | Last period to this period, deltas named and owned | Finance (costs), marketing (spend and mix) |
The scenario table | What happens next | Three spend levels, contribution outcomes, break-even mark | Marketing, on finance's margin definition |
The assumption register | Why the numbers deserve trust | Every input, its source, your confidence in it | The measurement stack, one column per source |
The measurement plan | How the claim gets verified | The 90-day check, and what gets reallocated if it fails | Marketing and analytics jointly |
The scenario table doubles as the marketing budget proposal in the format finance natively reads, and the register is what separates a forecast from a wish.
One mechanical note that outweighs the formatting: bring the number you were embarrassed about last time, pre-briefed. Alignment between the chief marketing officer (CMO) and the CFO is not built in the meeting; it is built the day before, on the weakest number in the deck.
What you can copy: the week before the meeting
Agree the variable cost list with finance. Half a day, and the output is one shared sheet. The blocker: the list does not exist yet, and building it surfaces every disagreement early, which is the point.
Rebuild last quarter as a bridge. One day once the cost list exists; the output is the one-page waterfall. Proving the method on known numbers earns the right to forecast with it. The blocker: clean cost data at order level usually is not where you think it is.
Write the assumption register first, the scenarios second. Half a day each; the outputs are the register and the three-column table. Scenarios inherit their credibility from the register, never the reverse.
Pre-brief the CFO on the number you are least sure about. Thirty minutes, the day before. Surprise is the enemy; a flagged weakness reads as competence.
Agree in the meeting how the claim gets checked in 90 days. The output is the measurement plan with a date on it. A budget granted against a verification plan is a budget that survives the next reforecast.
Work with a growth strategy team that starts from your contribution line
Darkroom serves high-growth brands across consumer, mid-market and enterprise, and the growth strategy engagement begins exactly where this article does:
The diagnostic audits every active channel and establishes a contribution profit baseline, so marketing and finance argue from one number.
A live Flight Plan connects business goals, the direct-to-consumer (DTC) P&L, media investment and daily pacing, which is the scenario table kept current instead of rebuilt each quarter.
Shadow, Darkroom's measurement platform, replaces last-click attribution with media mix modeling and root-cause analysis. The same operating system drove Laundry Sauce to 290% net revenue growth on Amazon with repeat order rate up 23%.
Talk to Darkroom's growth strategy team →
Frequently Asked Questions
What is contribution margin?
Contribution margin measures how much of each order's revenue survives once every variable cost is paid: goods, freight, payment processing and variable marketing. Expressed as a percentage of revenue, it shows what each incremental dollar leaves behind to cover fixed costs and generate operating profit, which is why finance plans with it.
What is the difference between contribution margin and gross margin?
Gross margin subtracts only the cost of goods sold. Contribution margin also removes fulfilment, shipping, payment fees and variable marketing, so it is always lower and more honest about ecommerce orders. An order can look healthy on gross margin and still lose money once every variable cost is counted.
How do you calculate contribution margin for an ecommerce brand?
Start with net revenue, then subtract cost of goods sold, fulfilment and freight, payment processing, and variable marketing including agency fees. Divide the result by revenue for the ratio. The hard part is not the arithmetic; it is agreeing the variable cost list with finance before anyone builds a model on it.
What contribution margin do you need to fund marketing?
There is no universal threshold. The floor comes from your own fixed-cost base, because contribution has to cover overhead before anything reaches operating profit. Divide total fixed costs by revenue to find the minimum ratio the business needs, then require incremental marketing spend to clear its share of that bar.
How does a CFO evaluate marketing spend?
Through four questions: whether the incremental dollar returns more than it costs at real margin, how quickly the spend pays back in cash, whether the return is proven to be caused rather than correlated, and what the plan does to inventory, cash timing and the rest of the business. Bring one artifact per question.
What is a contribution margin bridge?
A bridge explains the change in contribution between two periods as named, quantified deltas: volume, price and discount depth, cost of goods, acquisition cost and customer mix. It turns "margin is down" into a list of causes with owners, which is why finance treats it as an operating document rather than a chart.
Should a marketing budget be a fixed percentage of revenue?
No. Percentage-of-revenue budgeting is a heuristic, not a method: it scales spend with last year's outcome instead of this year's opportunity. Replace it with scenario-based planning, where each spend level carries a forecast contribution outcome and a named assumption, and the budget follows the best-supported scenario.