
DATA & ANALYTICS
Ecommerce Data Infrastructure in 2026: The Stack, the Costs, and the BFCM Deadline




Written by Darkroom leardership
Last update: August 11, 2026

Almost every guide to this subject is written by data engineers for data engineers. This one is written for the marketing leader who has a vendor quote on their desk, a peak trading season approaching, and no way to tell which line items are real requirements and which are upsell.
That distinction matters more than it used to. Tooling in this category has become genuinely cheap at the bottom and genuinely opaque at the top, and the gap between those two facts is where most budget gets wasted.
What is ecommerce data infrastructure, and which parts actually matter?
Four layers matter, and they matter in a fixed order: collection, warehouse, customer data platform (CDP), analytics. Each one only works if the one below it is sound, which is why buying out of sequence is the most expensive mistake in this category.
Collection is how events get captured, usually a tag manager plus platform pixels and server-side events. The warehouse is where that data lands so it can be joined to orders, subscriptions and support tickets. The CDP resolves those records into one person. The analytics layer turns the result into a decision.
The consequence of getting this wrong is not abstract. When your systems disagree about which channel produced a sale, budget moves toward whichever channel reports most aggressively. At $10M in revenue that is an annoyance. At $200M it is a misallocated quarter, and by the time the profit and loss statement shows it, the quarter is over.
There is also an ownership problem that no architecture diagram captures. In most consumer brands this layer is split three ways between an agency that owns the pixels, a development partner that owns the site, and a lifecycle manager who owns the email platform. Nobody owns the joins between them.
That is usually the real reason a stack degrades. Not a bad tool choice, but three competent parties each maintaining their own piece correctly while the seams between them quietly rot. Before you buy anything, work out who is accountable for the whole chain.
Which layer do you actually need first?
Start at the bottom and stop as soon as the next layer solves a problem you do not have yet. Most consumer brands between $10M and $500M need the first two layers properly built and can defer the third longer than vendors suggest.
The trigger for each layer is a symptom, not a revenue number. Revenue thresholds are how software gets sold. Symptoms are how you know.
Layer | What it does | What breaks without it | When you actually need it |
|---|---|---|---|
Collection | Captures events from site, app and ad platforms into one managed container | Numbers change depending on who pulls them, and nobody can say why | Immediately. This is table stakes and it is free |
Warehouse | Stores raw events and orders together so they can be queried and joined | You can describe what happened on one platform but never across all of them | When you need to analyse orders alongside ad spend or support history, which for most brands is already true |
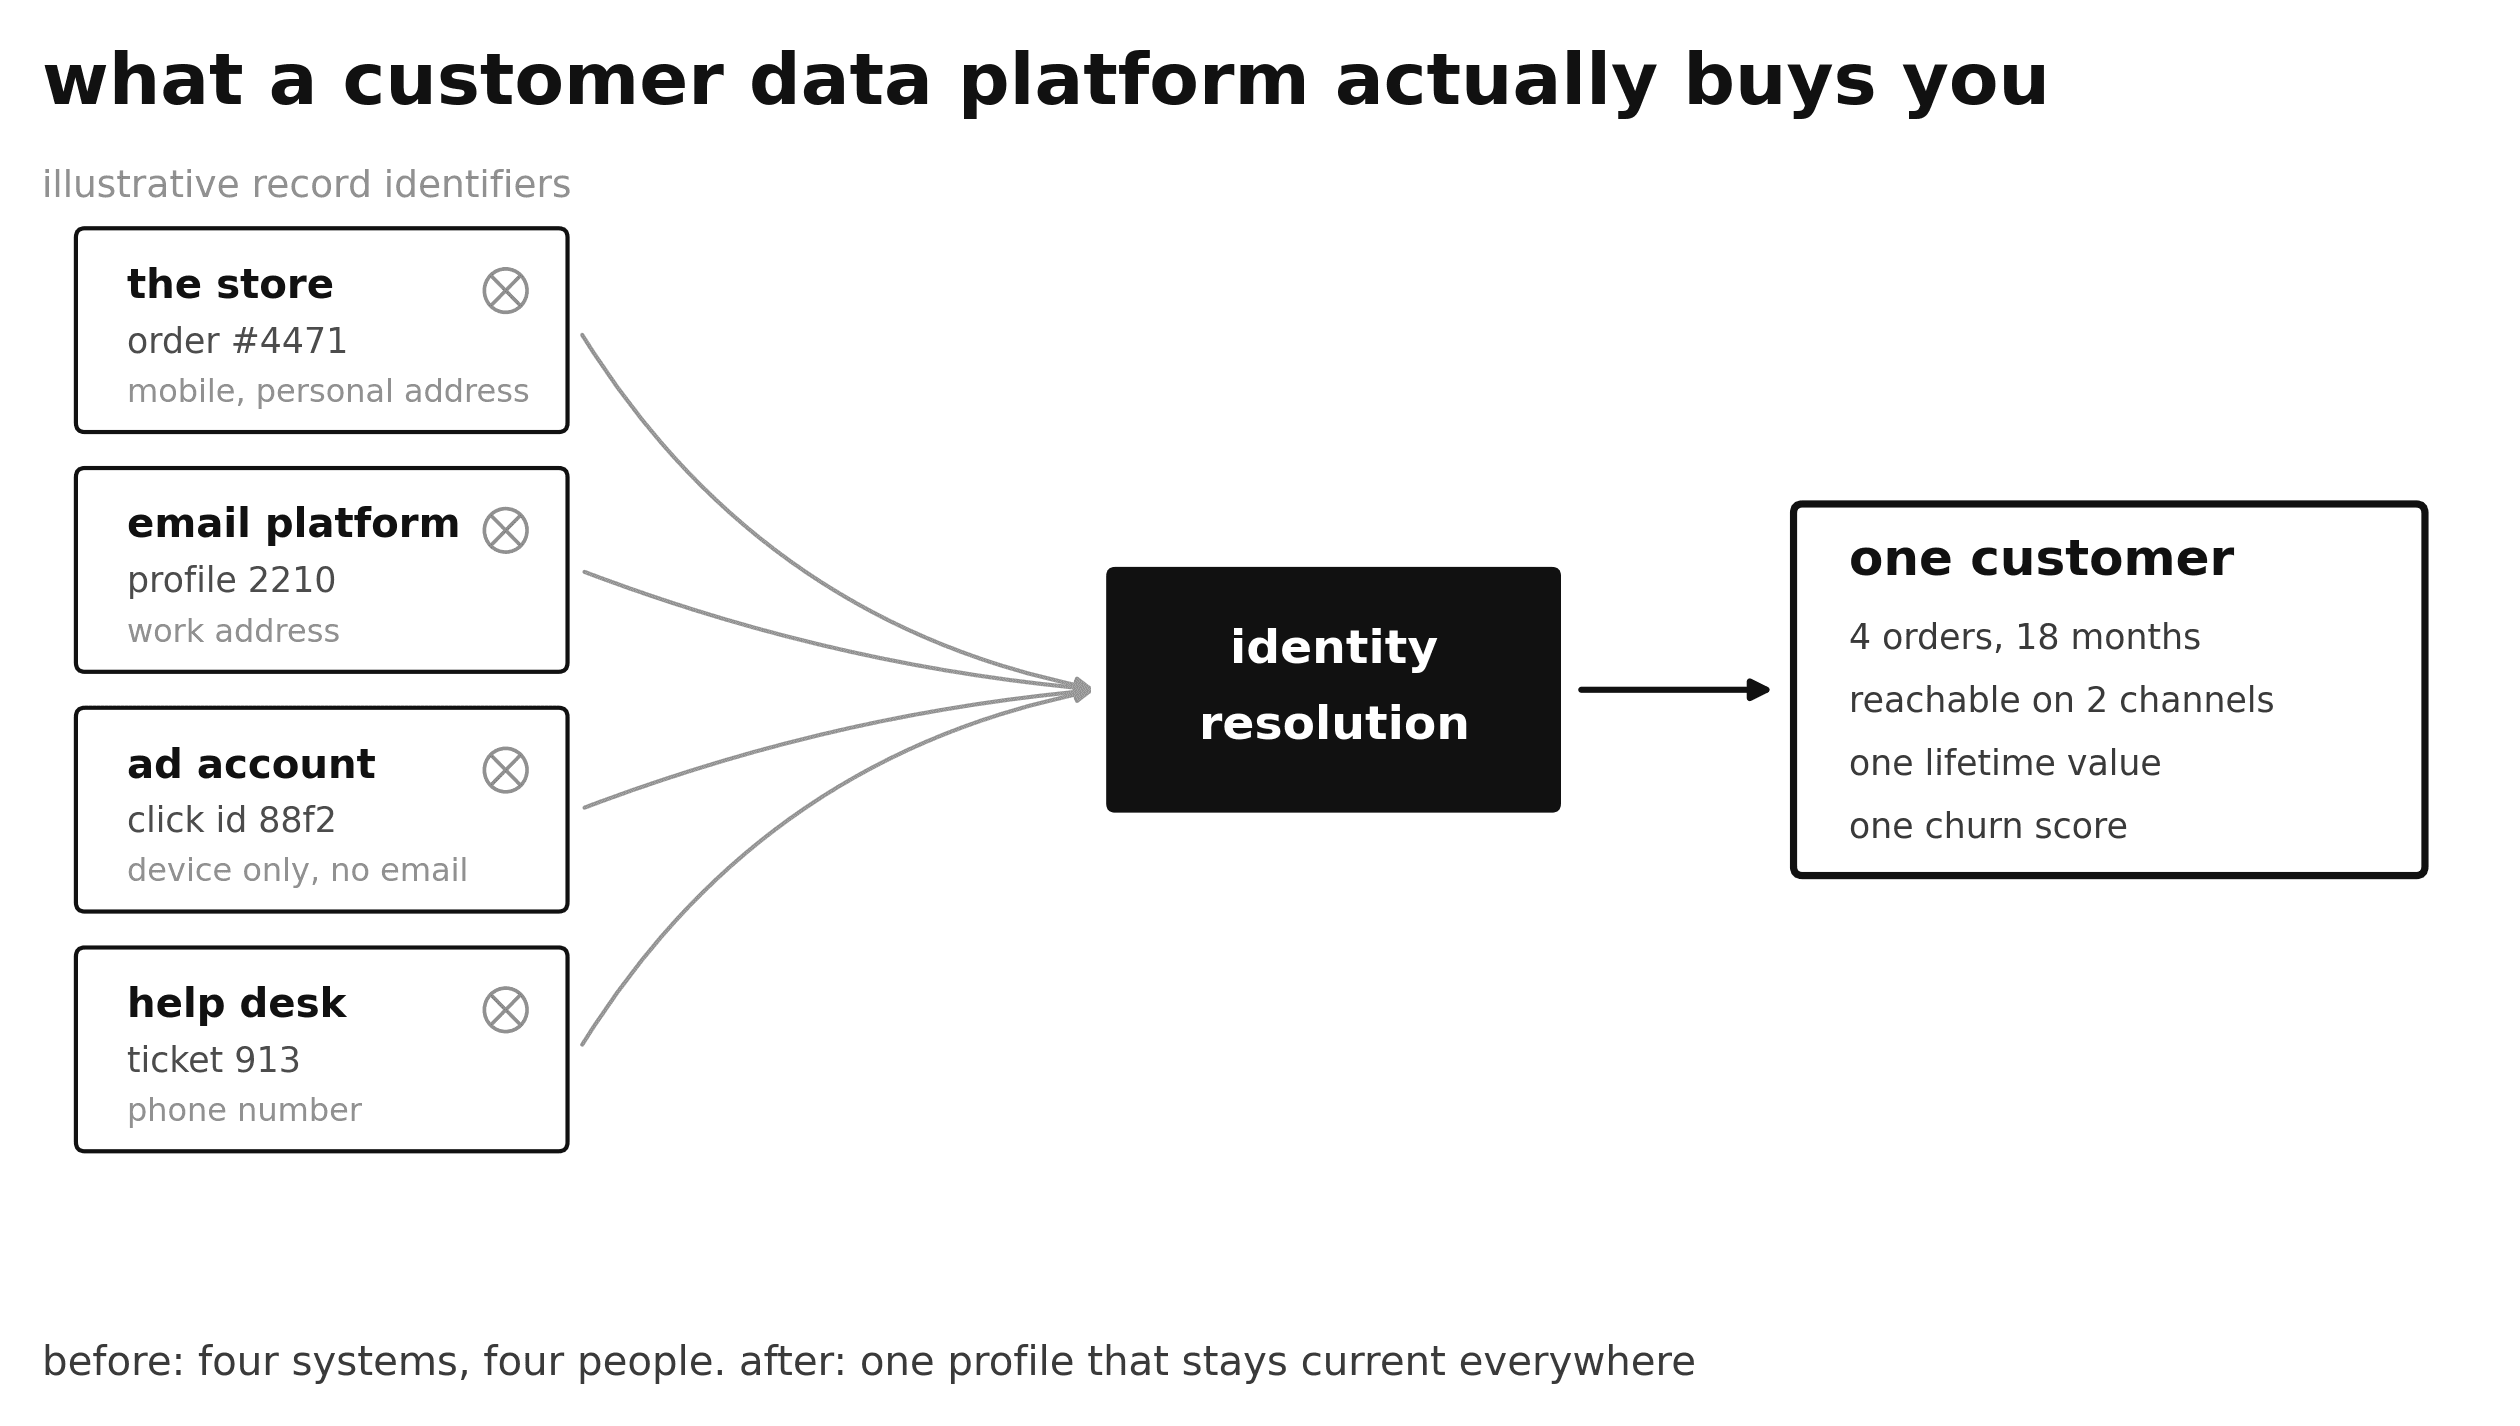
Customer data platform | Resolves one person across devices, emails and systems, then pushes that profile back to the tools that act on it | The same customer exists as four different people, and your segments are built on fragments | When more than two systems disagree about who a customer is and manual reconciliation has become somebody's job |
Analytics layer | Surfaces what changed and predicts what happens next | You only learn about problems you thought to ask about | Once the warehouse holds enough clean history to model against, typically a year in |
The most common error is buying the third layer to fix a problem in the first. Identity resolution cannot repair events that were never captured cleanly, and no platform will tell you that during a demo.
In practice this looks like a brand signing a substantial annual contract for unified profiles, then discovering six months in that a third of its sessions were never attributed to a user at all because a consent banner was blocking the tag. The platform worked exactly as sold. It simply had nothing to unify.
How much does a 2026 ecommerce data stack cost?
Less than most brands expect at the bottom, and harder to pin down than it should be at the top. The cheapest layers publish flat rates. The expensive ones price against your size, your commitment term, or a sales call.
Here is what the market charges, verified against each vendor's own pricing page on 11 August 2026. Every figure below carries the conditions that determine what you will actually pay, because a price without its conditions is not a price.
Layer | Representative option | Published price, verified 11 August 2026 |
|---|---|---|
Collection | Google Tag Manager | Free |
Warehouse | BigQuery on demand, US multi-region, logical storage | First 10 GiB of storage and first 1 TiB of queries free each month. Beyond that, $23.55 per TiB per month for active storage, about $16.38 per TiB once a table is untouched for 90 days, and $6.25 per TiB scanned by queries. Physical storage bills at a different rate, and rates vary by region |
Attribution | Free tier at $0 with no contract. Starter from $179 per month, Advanced from $259, both on 12-month subscriptions. Custom from $539 per month for brands above $20M annual gross merchandise value (GMV), quote only. Prices move with a GMV slider running from under $250K to $350M+ | |
Customer data platform | Quote only. The full platform with identity resolution has no published price and no free tier. Quotes are driven by monthly tracked users | |
Analytics layer | Bundled into higher attribution tiers, or bought separately | Varies. Most predictive features sit inside plans you are already paying for |
Working stack, excluding a CDP | Tag manager, warehouse and attribution together | Under $1,000 per month for a typical mid-market brand |
A unit note, since this is an article about not being misled by pricing: Google bills in tebibytes and gibibytes, not terabytes and gigabytes. A TiB is about 10 percent larger than a TB, so converting between them casually is exactly the kind of error this article exists to prevent.
Two things follow from that table, and both are counterintuitive.
The warehouse is the cheapest serious line item you will buy. A brand doing $30M with disciplined query habits can sit inside or near BigQuery's free monthly allowance, and even at real volume it rarely becomes the largest number on the invoice. The layer people fear most is the one that costs least.
The customer data platform is the most expensive, and you cannot price it without a sales call. That is not a criticism of any vendor. It is a structural fact about how the category sells, and it tells you something useful. If a layer will not show you a price, treat buying it as a commitment rather than a purchase.
Be honest about the middle of that table too. The attribution layer looks transparent because it prints numbers, but those numbers move with your GMV and assume a twelve-month subscription, and the top tier is quote-only like the CDP. A brand at $50M will not pay the figure a brand at $5M sees. Read every published rate in this category as the price at one revenue band rather than a list price.
Why warehouse bills surprise people: you pay for data scanned, not data stored
Cost here is driven by query behaviour rather than by how much history you keep. A dashboard set to refresh every fifteen minutes against an unfiltered table will generate a bill that has nothing to do with your size.
The fix is unglamorous and it works: limit refresh frequency to what someone actually acts on, and query date-partitioned tables rather than scanning everything. Get that right and the warehouse stays a rounding error on your marketing budget.
That also explains the summary row above. Tag management is free, a disciplined mid-market brand's warehouse usage lands in the tens of dollars, and a capable attribution tier sits in the low hundreds. Identity resolution is what moves the total into a different order of magnitude, and because CDP quotes scale with monthly tracked users, that number grows with your traffic rather than with the value you extract.
Do you need a CDP, or will the warehouse do?
For most brands in this range, the warehouse plus a path to push data back out to your marketing tools does the job. The CDP earns its cost when identity resolution becomes the bottleneck, and not before.
The distinction is narrower than the marketing around it suggests. A warehouse stores and lets you query. A CDP does one additional thing that genuinely matters: it decides that the person who bought on mobile using a personal address and the person who opened your last campaign at a work address are the same human, then keeps that judgement current everywhere.
You need that when the alternative has become manual. If someone on your team spends part of every week reconciling customer records between platforms, you are already paying for a CDP in salary. If nobody is doing that work, you are not ready to buy one.
The cheaper middle path is worth knowing about. Tools that read directly from your warehouse and sync segments out to your email, SMS and ad platforms give you most of the activation benefit without a separate profile store, and they leave the data where you already control it.
That approach also protects you commercially, for the reason set out above: pricing that tracks user counts punishes brands growing traffic faster than revenue, and keeping activation in the warehouse keeps that exposure off the table.
Where the layer genuinely pays off is activation quality. Segments built on a resolved profile behave differently in email and SMS than segments built on whatever a single platform happens to know. For a full evaluation of the tools here, including where vendors oversell, read our breakdown of what a retention stack actually needs.
What changed in attribution, and what should you stop reporting?
Stop reporting attribution models that no longer exist in the tool they supposedly came from. In November 2023 Google removed four models from Google Analytics 4 (GA4), and a surprising number of brand reports still show them.
Google's documentation is unambiguous: "The first click, linear, time decay, and position-based attribution models are no longer available as of November 2023." If a slide in your weekly review shows linear or time-decay attribution and cites GA4 as its source, that number came from somewhere else, and finding out where is a worthwhile hour.
What GA4 still offers is data-driven attribution alongside two last-click variants. That is a narrower menu than most reporting templates assume, and templates built before 2024 have generally not been updated.
The deeper principle has not changed. No single source captures a customer journey, because the platforms competing for credit do not share data with each other. You weigh several sources and accept that judgement remains.
That is not a failure of rigour, it is the honest state of the discipline. It is also why treating platform-reported numbers as a measurement layer keeps producing budget decisions that do not survive contact with the P&L.
Media mix modelling sits above all of this and is frequently mis-sold on data requirements. Google's Meridian documentation, checked on 11 August 2026, works the arithmetic through: "With two years of weekly data (104 data points), you have four data points per parameter."
Four observations per parameter is not enough to estimate a model you would move budget on, which is why the same page steps up to three years and 156 data points in its worked example. Treat any modelling offer built on eighteen months of history with that arithmetic in hand. For how these pieces fit into something you can actually run, see the measurement stack.
What does an AI analytics layer actually do that a dashboard does not?
A dashboard answers a question you already thought to ask. An analytics layer surfaces the question. That is the entire difference, and it is worth more than it sounds.
Three capabilities here are worth paying for today.
Anomaly detection. Something moves in spend, conversion rate or margin, and you hear about it the same day rather than in a monthly review. Much of the value in this layer is simply compressed reaction time.
Natural language querying against your own data. A merchandising lead can ask which bundles drove repeat purchase last quarter without waiting for analyst capacity. The bottleneck in most brands is not insight; it is queue.
Predictive outputs. Churn probability and predicted customer lifetime value, calculated continuously and fed into segmentation, so a model decides who to talk to rather than a rule someone wrote last year.
Now the limits, because this is where the category oversells hardest.
Predictive outputs are only as good as the identity resolution underneath them. A churn model built on fragmented records will confidently flag people who simply bought again under a different email address. That is the argument for sequencing: this is the most exciting purchase on the list and the one that punishes you hardest for skipping the two below it.
There is a straightforward way to test a vendor in this layer. Ask them to run their model against a period you already understand and tell you what it would have flagged. A tool that surfaces something you missed is worth buying. A tool that confirms what you already knew is a dashboard with better marketing.
These models also need history, less than vendors imply but more than nothing. Our guide to AI email marketing sets out the practical thresh
What can you realistically fix in the 87 days before BFCM?
Enough, if you start in September. Black Friday and Cyber Monday (BFCM) fall on 27 and 30 November 2026, which gives you 87 days from the first of the month. That is comfortable for the first two layers and not enough for the third.
Start with the least glamorous item on the list: audit what you already have before adding anything. Rushed setups accumulate pixels and tags nobody owns, and the fastest improvement available to most brands is removing the duplicates and dead tags quietly corrupting the numbers. In September that stops being good hygiene and becomes a task with a deadline.
Window | What to do | Why this deadline |
|---|---|---|
September | Audit and remove duplicate or inactive tracking. Connect your warehouse and start accumulating clean history | Every week you delay is a week of peak-season history you will not have next year |
Early October | Fix identity resolution where it is worst, rebuild your core segments on the cleaned data | Segments need to be live and validated before traffic arrives, not during |
Late October | Freeze structural changes. Validate that reporting reconciles against your platform of record | You want to find discrepancies while there is still time to investigate them |
November | Reporting and monitoring only. No migrations, no new tools, no schema changes | A stack you cannot roll back is worse than a stack you did not upgrade |
The rule for November is worth stating flatly: nothing structural ships. The cost of a broken integration during peak is not the engineering time, it is the decisions you cannot make while it is broken.
If you are reading this later in the year, the honest answer changes. From mid-October, do the tracking audit and nothing else, because it is the only item on the list that improves your numbers without touching how anything is wired. Everything else waits for January, when you will also have a full peak season of clean data to build on.
Fold this into your wider BFCM planning rather than treating it as a technical project running alongside the commercial one.

What this unlocks: the segmentation you cannot run today
The payoff is not a cleaner architecture diagram. It is that your retention program starts operating on who customers actually are instead of on what one platform remembers about them.
RFM analysis, which scores customers on recency, frequency and monetary value, makes the point better than any vendor pitch. It needs four columns per customer: an identifier, a last order date, an order count and a total spend. That is it. The maths was never the constraint.
The constraint is that most brands cannot produce those four columns accurately and currently, so segmentation runs quarterly on stale data instead of continuously on live data. The same is true of every predictive segment, every win-back trigger and every loyalty tier.
All of it is straightforward once the data underneath is trustworthy, and all of it is guesswork until then. This is also why the retention metrics that matter so often look wrong before this work is done, and why measuring retention properly depends on these layers rather than on the reporting itself.
Darkroom builds retention programs on top of this layer for high-growth consumer brands, working inside the stack you already run. Our retention practice publishes an 85 percent increase in customer lifetime value and 50 percent revenue growth within a year, with programs typically live inside 30 days.
Treat those as aggregate practice-level figures, stated on our retention page as of August 2026 and not attributable to any single brand. The standard this article applies to vendor numbers applies to ours.
In September, that 30-day window is the difference between arriving at peak with segmentation that works and arriving with segmentation you hope works. If you want a straight read on what your current data can and cannot support, book a free retention audit. We will tell you which layer is actually holding you back, including when the answer is that you do not need to buy anything.
Frequently asked questions
What is ecommerce data infrastructure?
It is the connected set of systems a brand uses to capture customer and order data, store it somewhere queryable, unify it into single customer records, and act on it. Four layers, built in order. Its purpose is decision speed, not data ownership, and it is judged on how quickly you can reallocate budget.
Do I need a data warehouse if I already use Shopify?
Yes, as soon as a question spans two systems. Shopify is a reliable source of truth for revenue and nothing beyond it, so anything combining orders with marketing or service data needs somewhere else to live. BigQuery's free monthly allowance makes that first step cost most brands almost nothing.
What is the difference between a CDP and a data warehouse?
A warehouse stores your data and lets you query it. A CDP resolves identity across systems and pushes unified profiles back to tools that act on them. Most mid-market and enterprise consumer brands should build the warehouse first and buy the CDP only when reconciling records manually has become someone's recurring job.
How much should a mid-market brand budget for its data stack?
Before a CDP, a working stack sits comfortably under $1,000 a month, since tag management is free and warehouse costs stay modest at typical volumes. The CDP layer is quote-only and changes the total substantially. All figures verified 11 August 2026, so re-check before budgeting.
Is it too late to fix our data before Black Friday?
In September, no. There are 87 days to Black Friday, which is enough for a tracking audit, a warehouse connection and a segment rebuild. By November it is too late for anything structural, and the correct move is to freeze changes, monitor closely, and schedule the work for January.