RETENTION MARKETING
RFM Analysis: How to Segment Customers by Recency, Frequency, and Monetary Value




Written by Darkroom leardership
Last update: July 31, 2026

RFM analysis is a customer segmentation model that scores every customer on three behaviors: recency (how recently they bought), frequency (how often they buy), and monetary value (how much they spend). Each customer receives a score from 1 to 5 for each dimension, producing segments you can target with distinct campaigns.
RFM analysis is the highest-leverage segmentation a DTC brand can build in one afternoon, and most email programs at the $50M+ level still have not built it. The same campaign goes to 800,000 people, the same 10% code goes to a champion and a stranger, and margin quietly leaks at both ends.
The model fixes that with data you already own. It is the customer segmentation ecommerce operators reach for first because it needs nothing beyond order history, and it pays for the afternoon fast: acquiring a new customer costs five to 25 times more than retaining one, and RFM tells you exactly which existing customers deserve the attention.
This guide gives you the full working system, drawn from the segmented lifecycle programs Darkroom operates for enterprise DTC brands: the scoring method, a worked example, a downloadable template, the 10 segments, and the email and SMS play for each one.
What is RFM analysis?
RFM analysis is a scoring method that ranks every customer on recency, frequency, and monetary value, then groups customers with similar scores into actionable segments. The RFM model was born in catalog retail decades ago and survives for one reason: past buying behavior predicts near-term buying behavior better than any demographic attribute you can rent.
That behavioral edge is worth real money. McKinsey's personalization research found that faster-growing companies drive 40% more of their revenue from personalization than slower-growing peers, and that personalization typically lifts revenue 10 to 15%. You cannot personalize against a list you have not segmented; RFM is the fastest credible way to segment one.
Here at Darkroom, we treat RFM as the entry layer of segmentation: good enough to change next week's revenue, simple enough that a lifecycle manager owns it without a data team.
Recency, frequency, monetary: what each measures
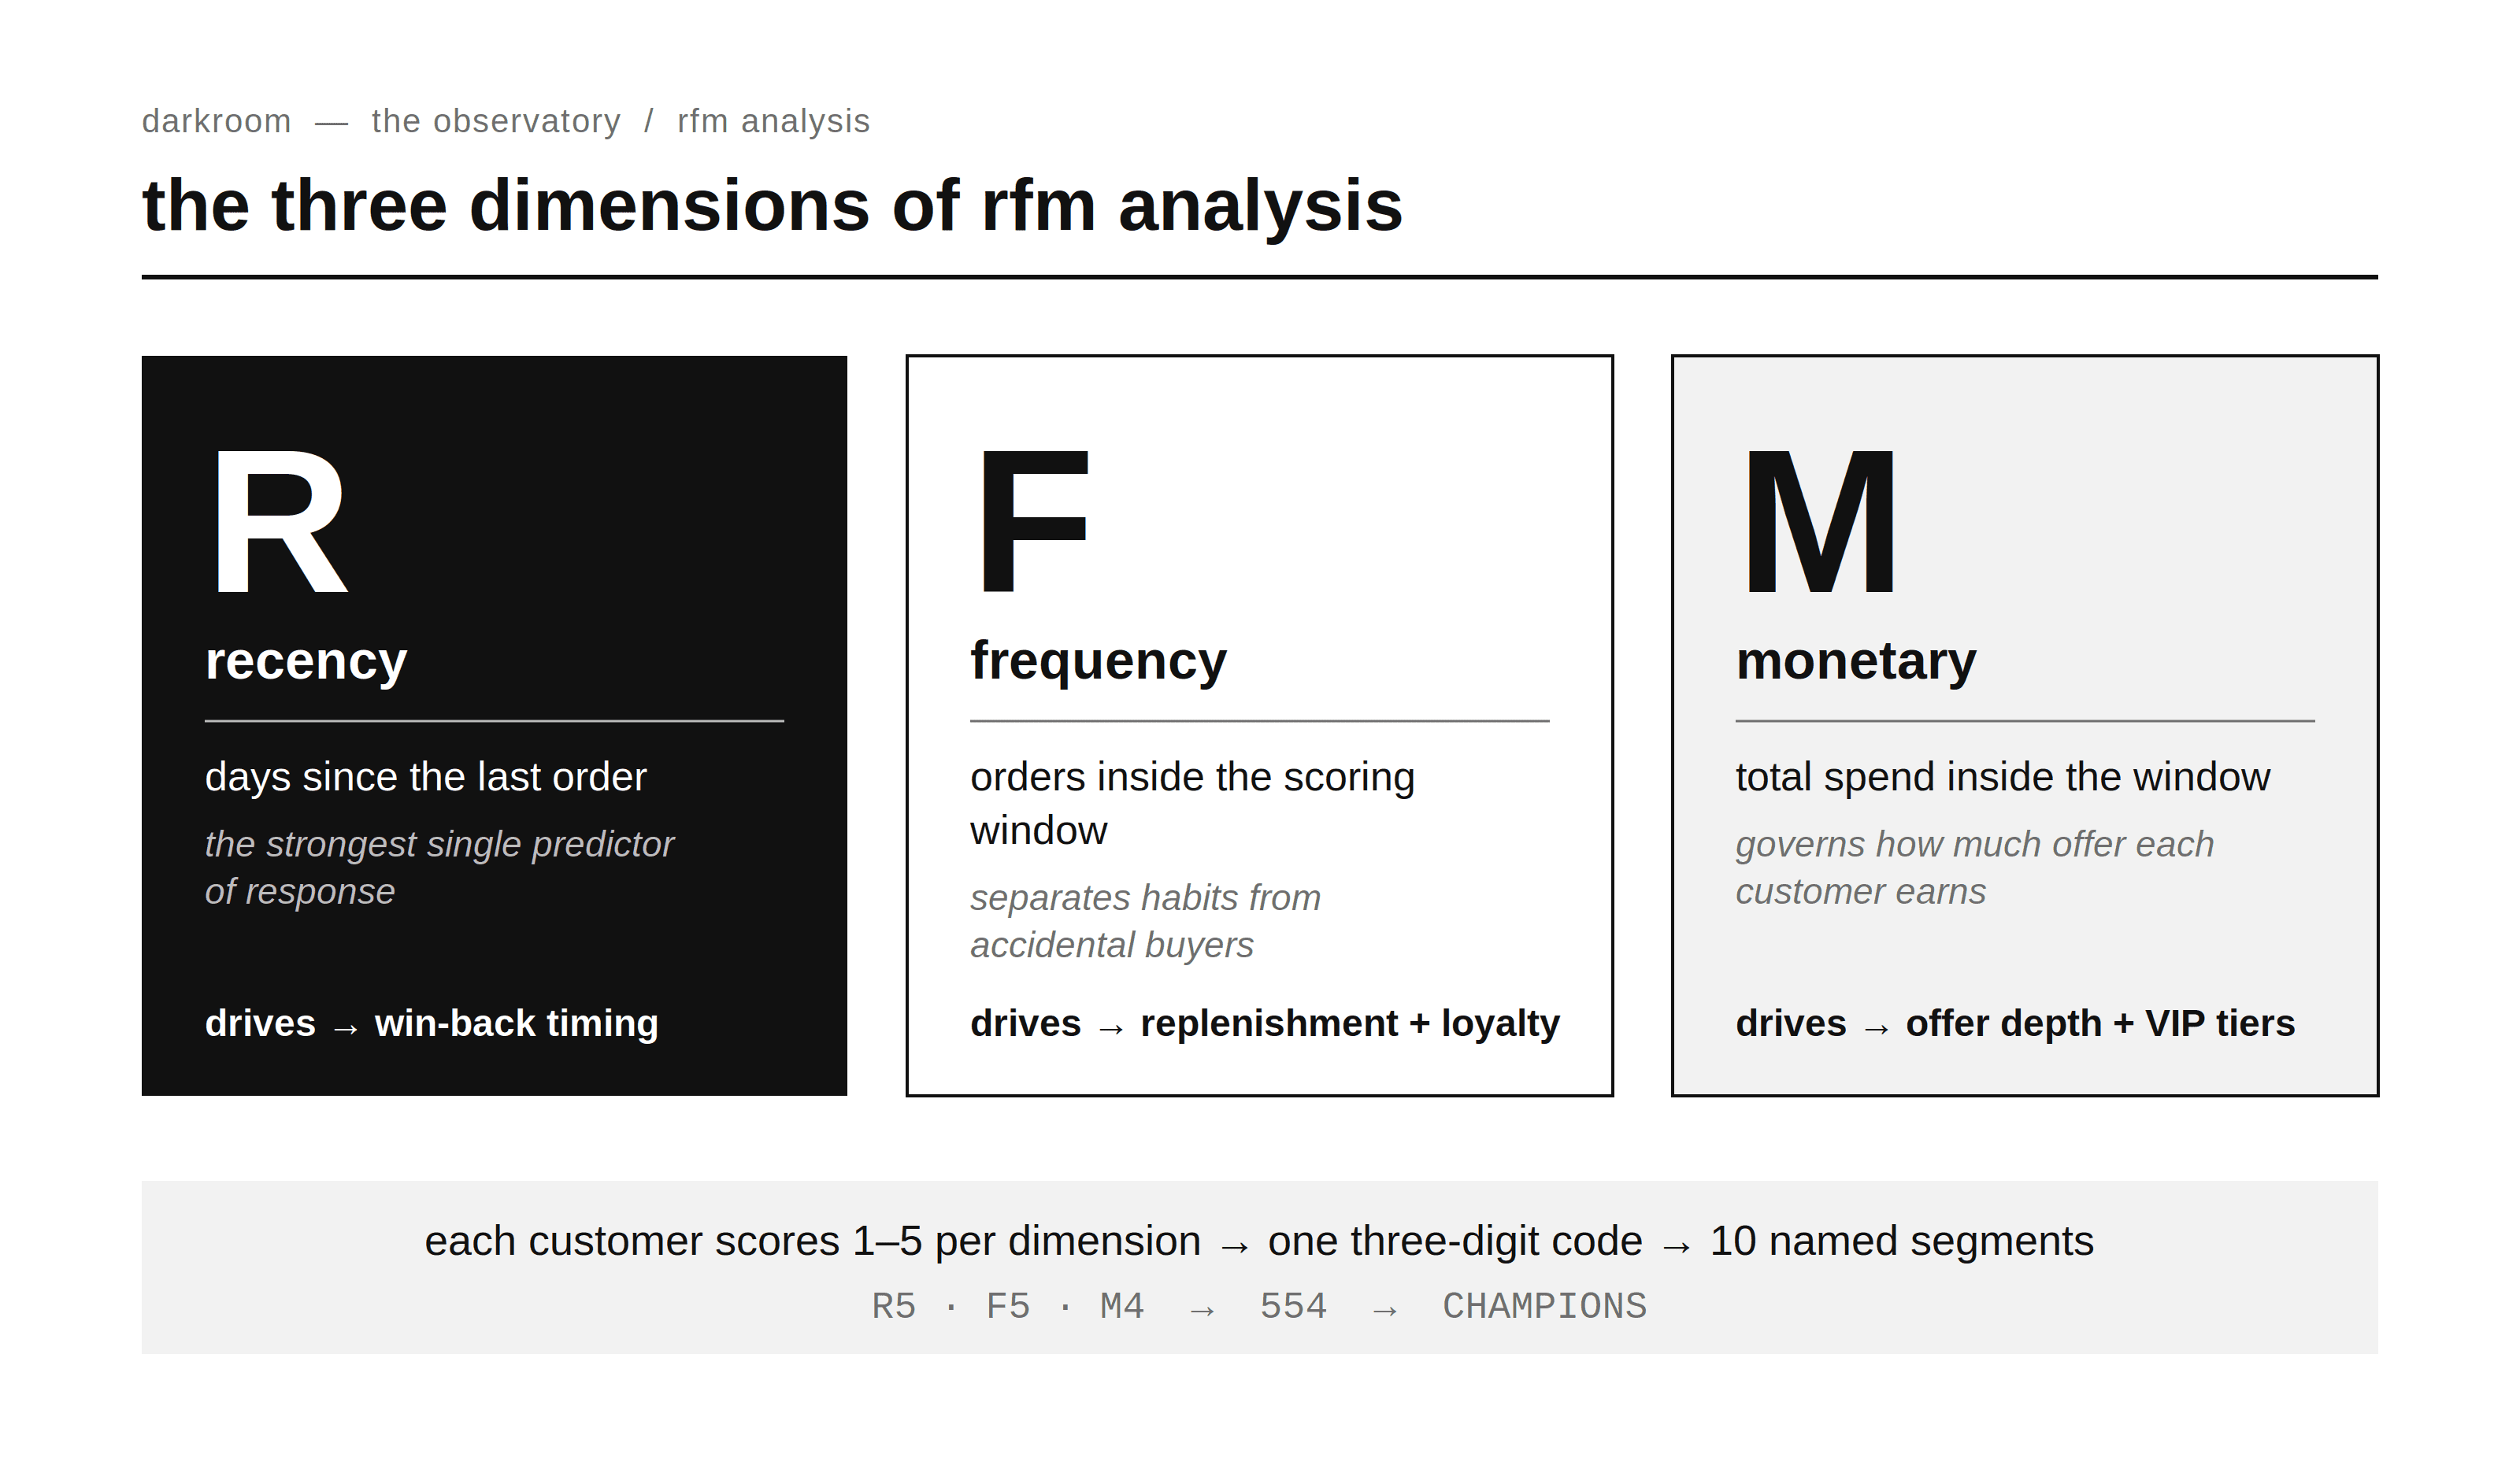
Recency, frequency, and monetary are also the order the code reads in, and each digit does a different job in the program.
Recency is days since the last order, and it is the strongest single predictor of response: a customer who bought two weeks ago is far more reachable than one silent for a year. Recency decides when intervention flows, as win-backs should fire.
Frequency is the count of orders inside your scoring window. It separates habits from accidents, and it drives replenishment timing and loyalty invitations.
Monetary value is total spend inside the same window. It sets how much you can afford to invest in each customer, which makes it the governor on offer depth: discount dollars should follow M scores, not blast schedules.
RFM vs. CLV: which one do you need?
Both, because they answer different questions: RFM reads today's behavior, while customer lifetime value projects long-run worth. RFM tells you who to message this week; CLV tells you what a customer relationship is worth over years and what you can pay to keep it.
RFM analysis | Customer lifetime value (CLV) | |
|---|---|---|
Answers | Who should get which message now? | What is a customer worth over time? |
Built from | Order history alone | Order history + margin + lifespan |
Horizon | Snapshot of the recent window | Multi-year projection |
Best for | Campaign and flow targeting | Budgeting, CAC ceilings, board math |
Refresh | Monthly to quarterly | Quarterly to annually |
They compose rather than compete. The strongest enterprise programs use RFM to route messages and CLV to size the investment behind each route.
How do you calculate an RFM score?
You calculate an RFM score by ranking every customer into quintiles on each of the three dimensions, assigning 1 to 5 per dimension, and reading the result as a three-digit code. The top 20% most recent buyers score R5, the top 20% by order count score F5, and the top 20% by spend score M5.
Best score = 555 · Worst = 111 · 125 combinations, mapped to 10 segments
Two calibration rules before you score. First, the scoring window should be roughly twice your purchase cycle; 24 months is the enterprise default, shorter for consumables. Second, quintiles need volume: at 200,000+ customers, a 1 to 5 scale is stable, while smaller files should drop to 1 to 3 so segment boundaries stop wobbling.
One deliberate simplification: keep the three dimensions unweighted at the start. Weighting M higher sounds sophisticated, but it buries the recency signal that drives most near-term response. Revisit weighting only after two refresh cycles of migration data, and only if your category has extreme order-value spread, like a furniture catalog sitting next to an accessories line.
Step-by-step scoring model
The full build is five steps, and at enterprise data volumes it runs in a warehouse query or a spreadsheet equally well.
Pull four columns per customer. Customer ID, last order date, order count, and total spend. Exclude refunds and wholesale accounts before anything else.
Set the scoring window. Twice your typical purchase cycle, applied to frequency and monetary; 24 months for most enterprise DTC catalogs.
Cut each dimension into quintiles. Rank all customers per dimension and split into five equal groups, 5 down to 1. Quintiles are relative, so your best 20% defines a 5 regardless of absolute numbers.
Combine the three digits. R, then F, then M: a customer scoring 5, 4, and 5 is a 545.
Map codes to segments. Collapse the 125 combinations into the 10 named segments below; nobody can run plays against 125 cells.
Worked RFM analysis example
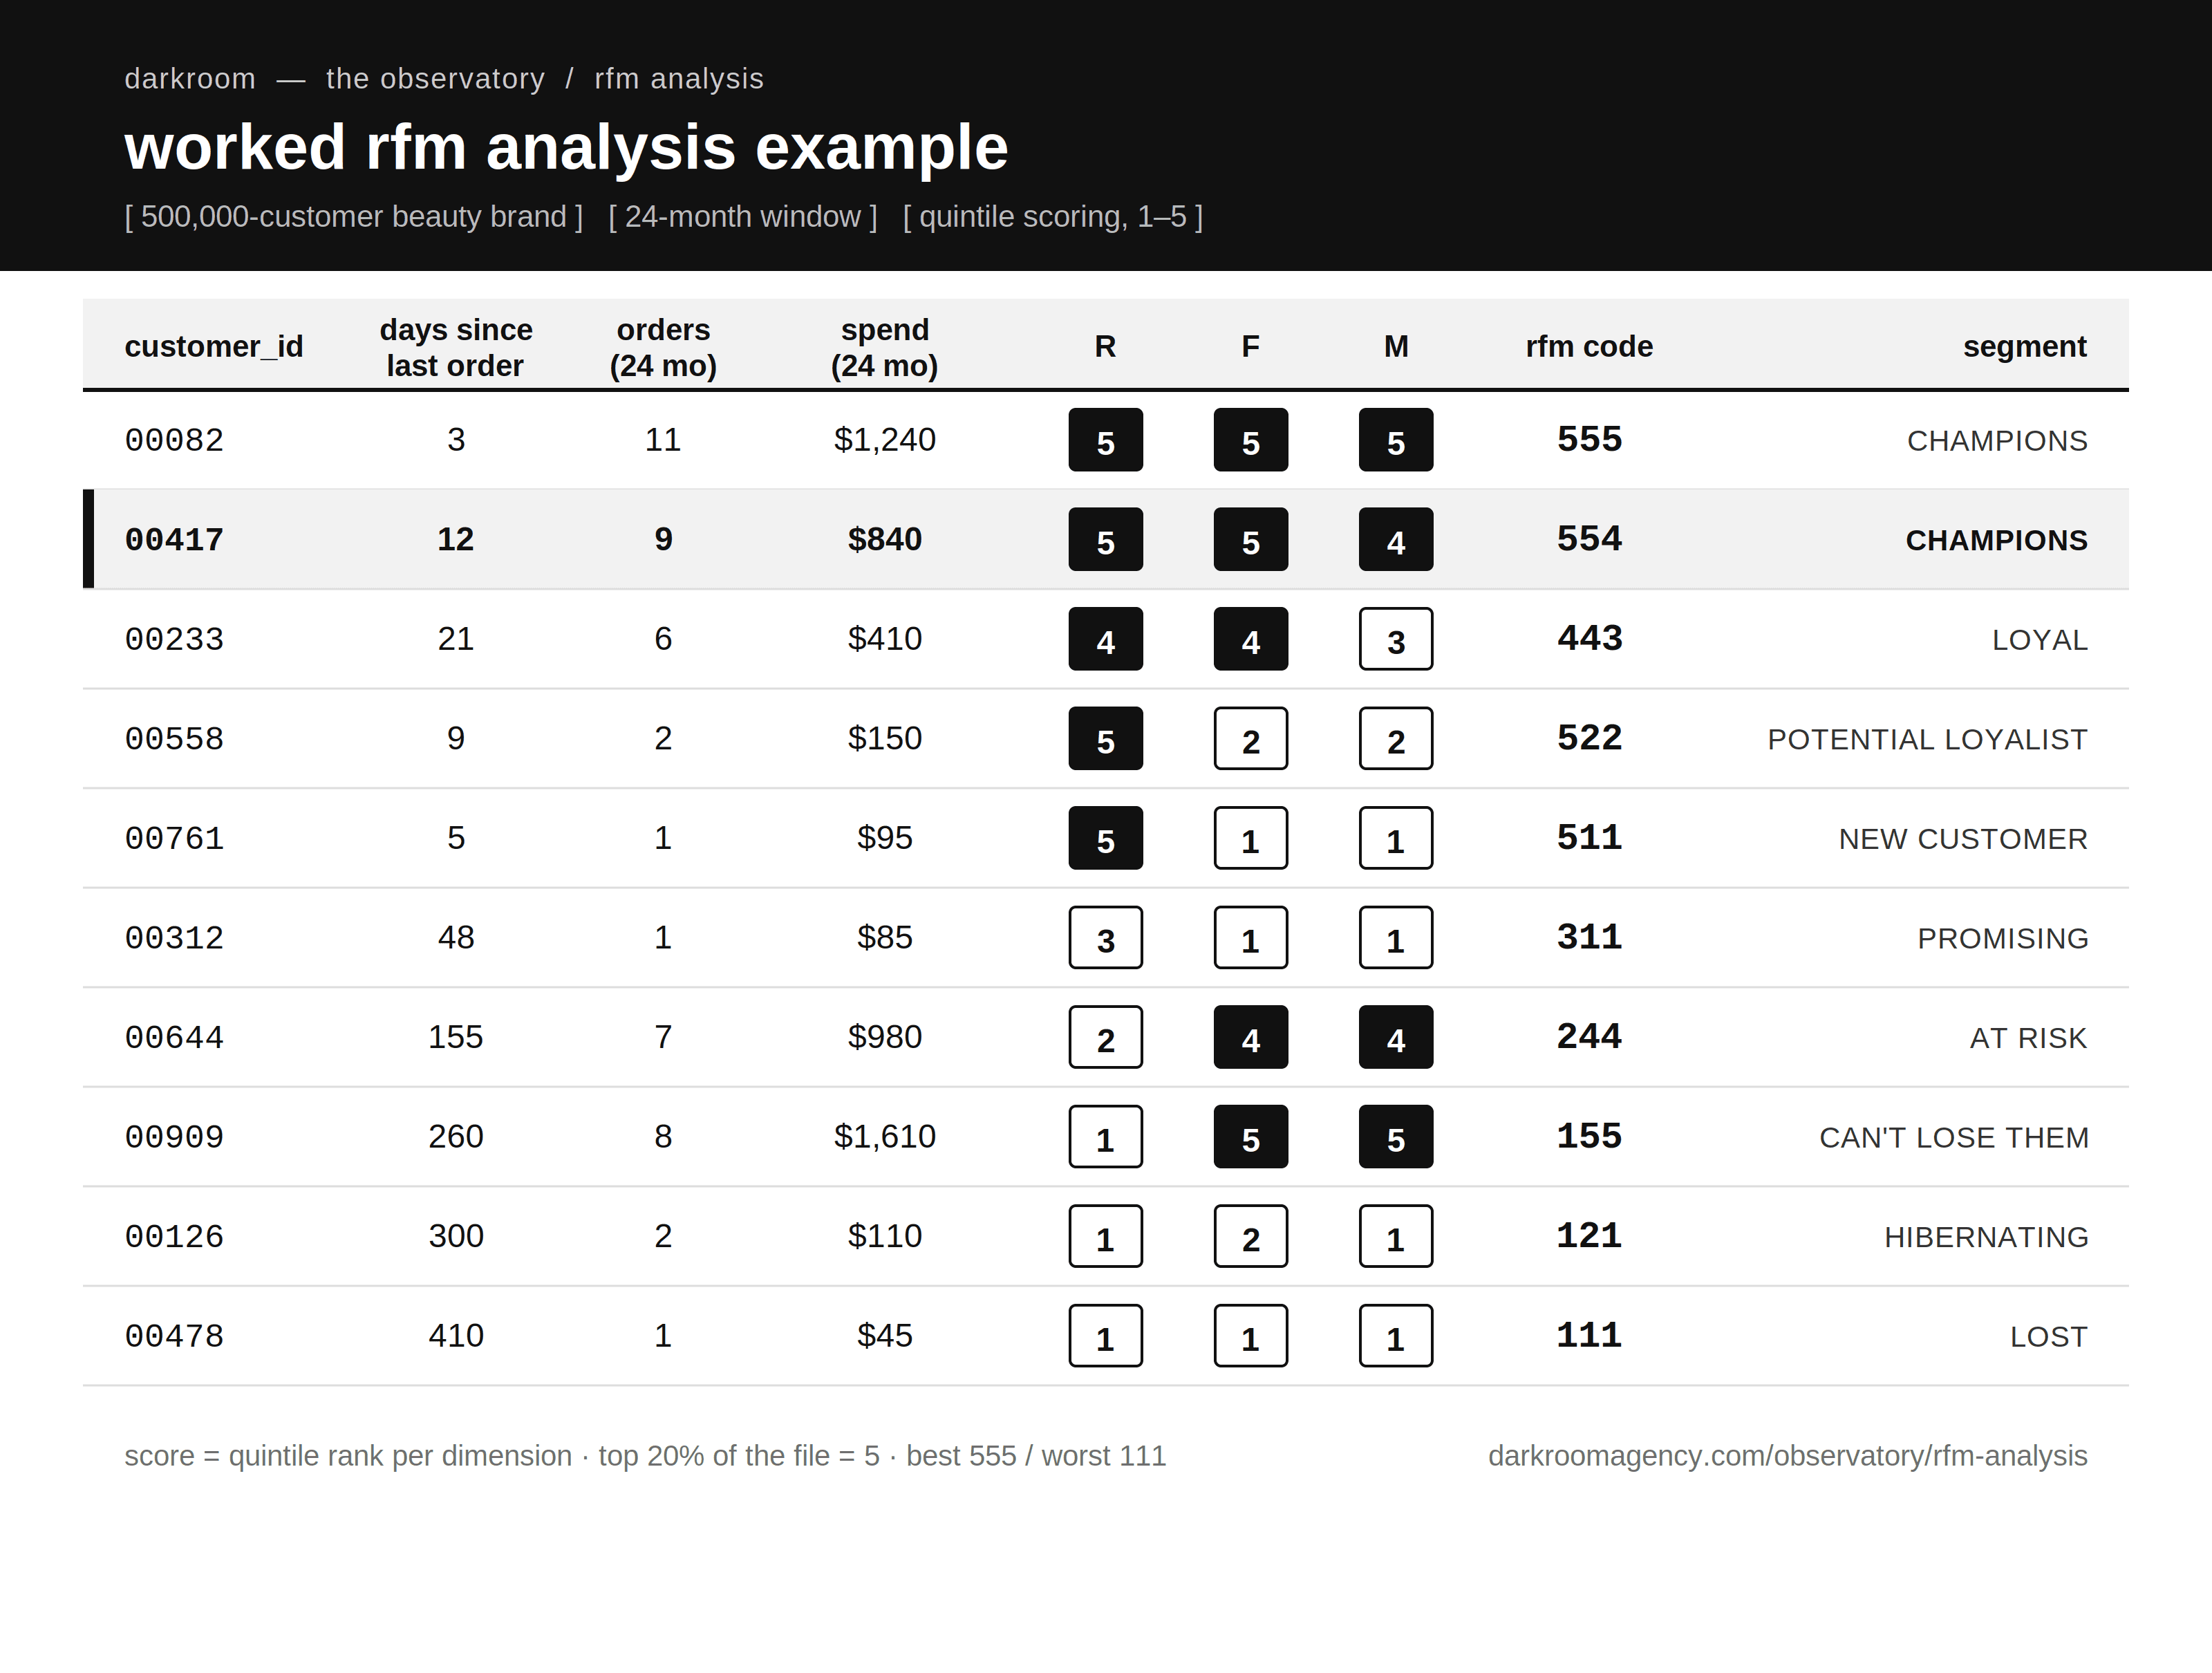
Take a beauty brand with 500,000 active customers and a 60-day purchase cycle. One customer last ordered 12 days ago, placed 9 orders in the 24-month window, and spent $840.
Against the full file, 12 days lands in the most recent quintile (R5), 9 orders lands in the top frequency quintile (F5), and $840 lands in the second spend quintile (M4). Code: 554. That maps to Champions, which means she should be getting early access and loyalty invitations, and should be suppressed from every blanket discount the calendar sends.
What are the 10 RFM segments every DTC brand should use?
The 10 RFM segments are Champions, Loyal Customers, Potential Loyalists, New Customers, Promising, Needs Attention, At Risk, Can't Lose Them, Hibernating, and Lost. Ten is the practical ceiling: enough resolution to differentiate the plays, few enough that every segment has an owner and a flow.
This is the RFM segmentation map we deploy across client programs, with share-of-base sanity ranges from the enterprise consumer files we review; treat the ranges as directional.
Segment | RFM pattern | Who they are | Typical share of base |
|---|---|---|---|
Champions | R 4–5, F 4–5, M 4–5 | Recent, frequent, high-spend; your compounding asset | 5–10% |
Loyal customers | R 3–5, F 3–5, M 3–5 | Reliable repeaters one tier below champion | 10–15% |
Potential loyalists | R 4–5, F 2–3, M 1–3 | Recent buyers building a habit | 10–15% |
New customers | R 5, F 1, M 1–2 | First order just landed | 5–10% |
Promising | R 3–4, F 1, M 1–2 | One order, still warm, no habit yet | 5–10% |
Needs attention | R 3, F 3, M 3 | Middling everything; drifting, not gone | 5–8% |
At risk | R 1–2, F 3–5, M 3–5 | Valuable customers going quiet | 8–12% |
Can't lose them | R 1–2, F 4–5, M 4–5 | Your former best customers, lapsing | 2–5% |
Hibernating | R 1–2, F 2–3, M 1–3 | Low value, long silent | 10–20% |
Lost | R 1, F 1–2, M 1–2 | One cheap order, long ago | 15–25% |
Read the table from top to bottom as a priority queue. The top four segments grow revenue; the middle three defend it; the bottom three are where reactivation budget goes to be tested, not assumed.
How do you activate RFM segments in email and SMS?
You activate RFM by giving each segment a distinct message, offer depth, and channel, instead of one calendar for everyone. Segmentation only earns money at the send layer, and the gap is an order of magnitude: Klaviyo's 2026 benchmarks across 183,000+ merchants show behavior-targeted automated sends earning 3x the click rate and 13x the placed-order rate of calendar campaigns. Email segmentation is where every RFM marketing program starts, because the list conditions already exist in your ESP.
Three rules govern the whole playbook. Offer depth follows M score, so discount dollars concentrate where they change behavior. Channel follows urgency: email vs SMS splits cleanly, with SMS carrying time-sensitive plays like expiring win-back offers and VIP drops while email carries story and education. And suppression is a play too: excluding champions from blanket promotions is often the fastest margin win in the whole system. The broader tactic library lives in our customer retention strategies guide.
Champions and loyal customers: protect the margin
The play for your top two segments is access, not discounts: early product drops, loyalty tiers, referral invitations, and review requests. These customers were buying anyway, so every blanket coupon they redeem is pure margin donation.
Offer-depth testing proves the point. When Darkroom rebuilt offer depth by segment for Morphe, one A/B produced 49% higher revenue per recipient at a lower offer, inside a program where flows drive 80% of retention revenue. Metric to watch: revenue per recipient and redemption margin, not open rate.
At-risk and lapsed: the win-back ladder
At-risk and Can't Lose Them are the segments RFM exists to catch, because they hold provable value that is actively decaying. Run the win-back email ladder by lapse depth: at one purchase cycle overdue, a no-offer nudge; at 1.5 cycles, a light incentive; at two cycles, your deepest offer with an expiry, and a channel switch to SMS for the final call.
Sequence design for this ladder lives in our churn flow strategies analysis, and for subscription businesses the same logic powers cancellation interception, covered in our subscription churn guide. Metric: reactivation rate per campaign, judged against the 5 to 15% band we see across enterprise win-back programs.
New and promising: engineer the second order
New and Promising customers have one job in front of them: the second order, which is where retention economics actually begin. The play is a second-purchase window calibrated to your product cycle, seeded by the welcome flow; our welcome email examples teardown covers the sends that do this best.
Cross-sell beats re-sell here: recommend the adjacent product, not a restock of an item they have not finished. Metric: second-purchase rate and time to second order, tracked by monthly cohort.
The middle and bottom segments get cheaper treatment by design. Needs Attention earns a re-engagement campaign before it decays into At Risk; Hibernating and Lost get two or three reactivation tests a year, in a low-cost channel, and otherwise stay suppressed. Suppressing 30 to 40% of a file from weekly sends is not lost reach; it is deliverability protection and a cleaner read on everyone who remains.
Where does RFM analysis break down (and where does AI take over)?
RFM has three honest limitations: it is a static snapshot that decays between refreshes, its quintile thresholds are relative rather than meaningful, and it describes the past without predicting the future. An R2 customer might be lapsing, or might simply be mid-cycle on a 90-day product; the model cannot tell the difference.
Seasonality compounds the static-snapshot problem at enterprise scale. A holiday-heavy quarter floods the file with R5 F1 customers and temporarily deflates everyone else's relative scores, so a January refresh reads very differently from an October one. Score against rolling windows and compare like-for-like refreshes, or the migration matrix will report noise as movement.
Predictive scoring closes the prediction gap. Instead of waiting for recency to collapse, models read leading signals like engagement decay and purchase-gap stretch and flag risk weeks earlier, per customer rather than per quintile. The tactics are in our AI strategies for email and SMS guide.
The compounding proof: when Darkroom layered segmented email campaigns and predictive replenishment onto Public Goods' program, retention-attributed revenue grew 37% quarter over quarter, with email campaign revenue up 44.7% QoQ. RFM built the segments; prediction decided the moment. Building that scoring layer is standard week-one territory for a retention program diagnostic.
How often should you refresh your RFM analysis?
Refresh RFM scores monthly for high-frequency categories and quarterly everywhere else; a score older than one purchase cycle is a guess wearing a number. Stale scores are how champions end up in win-back flows.
The real KPI is segment migration, not segment size. Track the net flow between segments each refresh: how many Potential Loyalists became Loyal, how many At Risk you recovered versus lost. A migration matrix turns RFM from a labeling exercise into a performance system, and the surrounding numbers live in our customer retention metrics hub.
If you are starting this week, the sequence is short:
Score the file. Four columns, five steps, one afternoon with the template above.
Ship three plays. Champion early access, the at-risk ladder, and the second-order push cover most of the near-term revenue.
Instrument migration. Baseline the matrix now so next quarter's refresh proves what moved.
Or have us run it end to end: Darkroom's retention program diagnostic starts with a week-one report on what is working, what is not, and a ranked list of revenue opportunities across your segments, flows, and offers. Book a call.
What is RFM analysis in marketing?
RFM analysis is a segmentation model that scores every customer 1 to 5 on recency of last purchase, frequency of orders, and monetary value spent, then groups similar scores into named segments. Marketers use it to match campaigns, offers, and channels to actual buying behavior instead of blasting one message to the full list.
How do you calculate an RFM score?
Rank all customers into quintiles on each dimension, assign 1 to 5 per dimension with the top 20% scoring 5, and combine the digits into a code like 545. Use a scoring window of roughly twice your purchase cycle, and drop to a 1 to 3 scale below about 30,000 customers.
What are the RFM customer segments?
The standard map collapses 125 score combinations into 10 segments: Champions, Loyal Customers, Potential Loyalists, New Customers, Promising, Needs Attention, At Risk, Can't Lose Them, Hibernating, and Lost. Each pairs a score pattern with one play, from early access for Champions to deep-offer win-backs for lapsed high spenders.
How many RFM segments should you have?
Ten is the practical ceiling for an operating program, and fewer is fine to start. Every segment needs an owner, a flow, and a metric; 125 raw combinations cannot clear that bar. Enterprise files with 200,000+ customers support full 1 to 5 scoring, while smaller lists should collapse to fewer, broader segments.
Is RFM analysis still relevant in 2026?
Yes, as the entry layer rather than the end state. RFM remains the fastest segmentation a team can build from order history alone, and ESPs like Klaviyo now compute it natively. Its limits- static snapshots and no prediction are exactly what AI scoring layers fix, so modern programs run RFM first and predictive models on top.