Retention Marketing
12 Customer Retention Metrics Every DTC Brand Should Track (With Formulas)




Written by Darkroom leardership
Jul 22, 2026

Customer retention metrics are the KPIs that measure how effectively a business keeps customers, increases their lifetime value, and builds long-term profitability. The 12 that matter for DTC brands cover rates, value, and relationship strength, but three carry the board deck: customer retention rate, customer lifetime value, and the CLV:CAC ratio.
Most retention dashboards are graveyards. Someone built 20 charts in a reporting sprint, nobody owns a single number, and the deck gets skimmed once a month. Across the 500+ consumer P&Ls Darkroom has reviewed in client work, the fix is never more metrics. It is 12 metrics, each with a formula everyone agrees on, a healthy range, and one lever that moves it.
That last part is what this guide adds. Plenty of pages define these metrics. This one treats each as an operating instrument: what it is, how to calculate it, what good looks like for a DTC brand, and what to do when the number is bad.
Why retention metrics matter (and which 3 executives actually ask about)
The economics are lopsided: acquiring a new customer costs 5 to 25 times more than retaining an existing one, and Bain research found that a 5% improvement in retention can boost profits by 25% to as much as 95%. With paid CPMs still climbing, retention is where DTC margin actually lives.
But not all 12 numbers deserve equal airtime. In our client reviews, one first-party pattern repeats, and executives consistently ask about three: customer retention rate (are we keeping people?), customer lifetime value (what is a customer worth?), and CLV:CAC (is the machine profitable?).
Lead your board deck with those. The other nine are diagnostic: they explain why the big three moved and which of your customer retention strategies to pull next.
The 12 retention metrics at a glance
# | Metric | Formula | Healthy DTC range* | Primary lever |
|---|---|---|---|---|
1 | Customer retention rate | ((E - N) / S) × 100 | 25–35% annually | Post-purchase lifecycle flows |
2 | Customer churn rate | (Lost / S) × 100 | 65–75% annually (inverse of retention) | Churn-flow interception |
3 | Repeat purchase rate | (Repeat customers / Total customers) × 100 | 45–65% consumables; 15–25% durables | Second-purchase incentive |
4 | Reactivation rate | (Reactivated / Lapsed targeted) × 100 | 5–15% per campaign | Win-back offer depth |
5 | Average order value (AOV) | Revenue / Orders | Category-dependent; trend up | Bundling and cross-sell |
6 | CLV:CAC ratio | CLV / CAC | 3:1 on contribution margin | Either side of the ratio |
7 | Customer lifetime value (CLV) | Revenue / Orders | 3× CAC or better | Frequency and margin mix |
8 | Purchase frequency | Orders / Unique customers | 1.8–2.5× annually (non-subscription) | Replenishment timing |
9 | Net promoter score (NPS) | % Promoters - % Detractors | 30+ for DTC | Product and CX fixes |
10 | Time between purchases | Median days between orders | Shrinking, or stable at cycle length | Trigger-send timing |
11 | Owned-channel revenue share | (Email + SMS revenue) / Total revenue × 100 | 25–35% | List growth and flow coverage |
12 | Loyalty member repeat rate | (Repeat members / Total members) × 100 | 1.5–2× non-member rate | Program benefit design |
*Ranges reflect what we see across consumer P&Ls at $5M–$100M+ revenue; treat them as orientation, not law. Your category, price point, and purchase cycle set the real target.
Core rate metrics
These four answer the most basic question in the business: do customers come back?
1. Customer retention rate
Customer retention rate is the percentage of customers you kept over a period, excluding the new ones you added along the way. It is the headline number for the whole discipline, which is why the formula needs to be exact.
The retention rate formula:
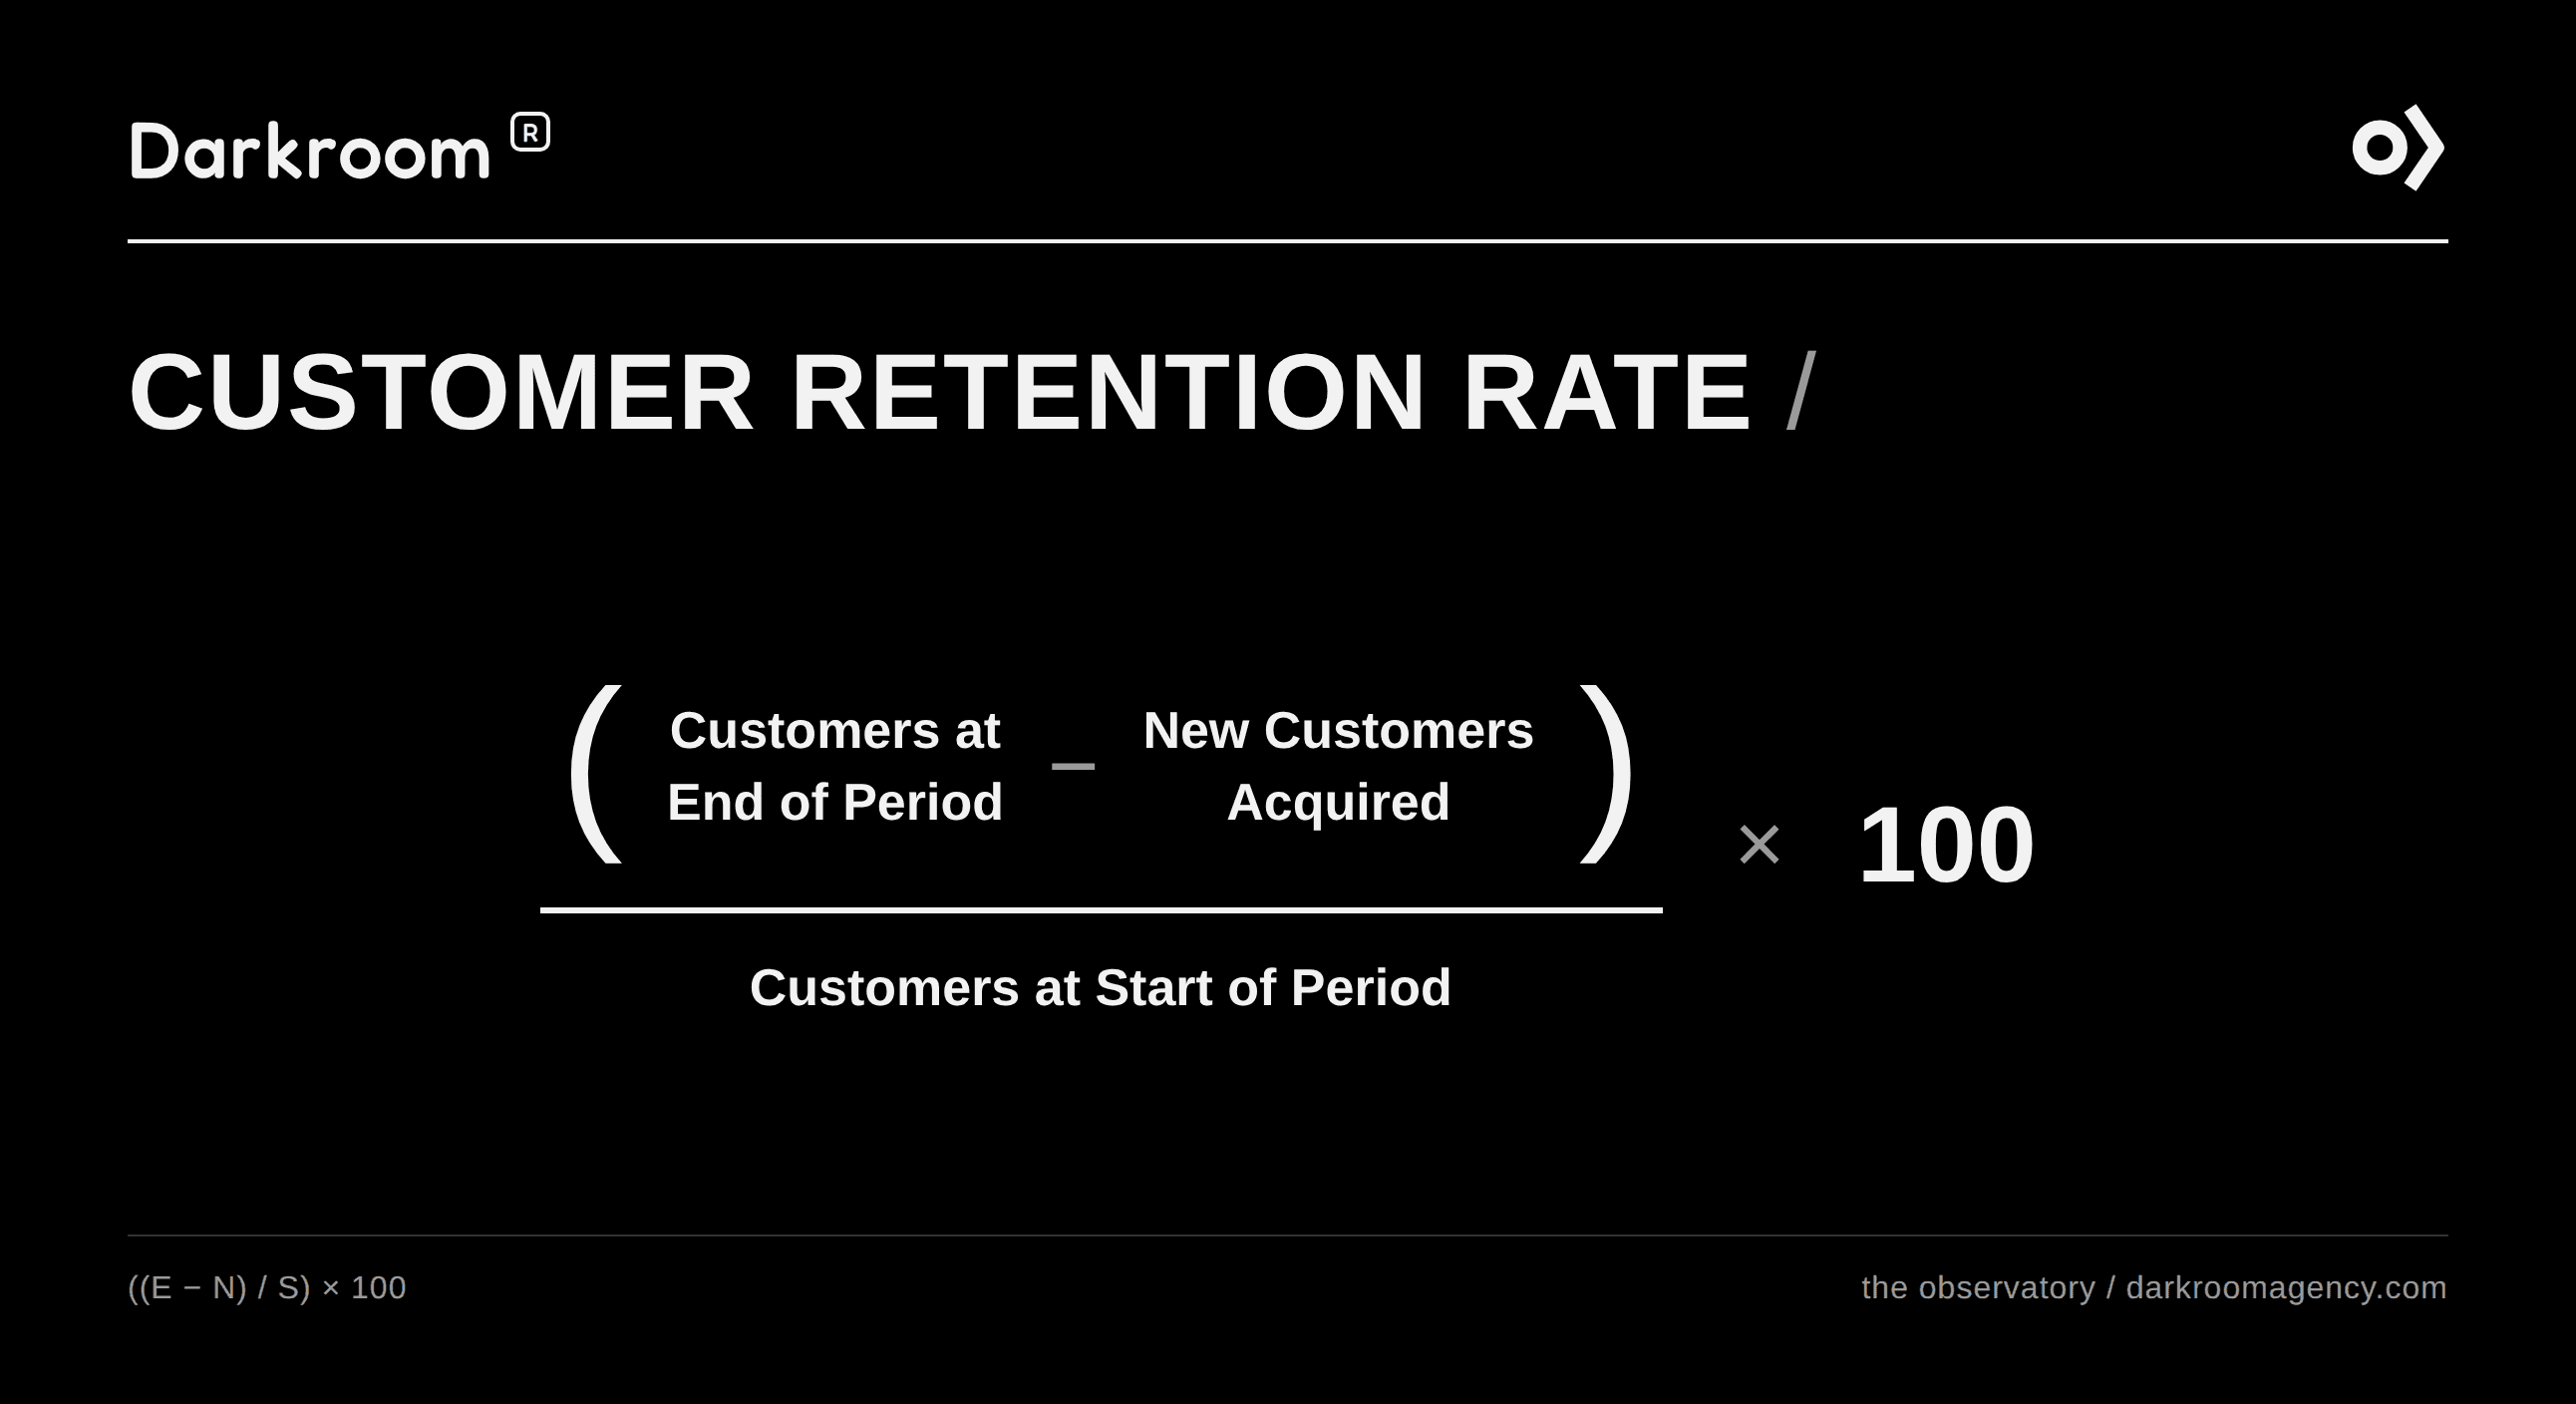
Customer retention rate = ((E - N) / S) × 100
E = customers at the end of the period
N = new customers acquired during the period
S = customers at the start of the period
In plain English: of the people who could have come back, how many did? Say you start the quarter with 2,000 customers, add 800, and end with 2,400. That is ((2,400 - 800) / 2,000) × 100, so a 80% quarterly retention rate.
Healthy range: for non-subscription DTC, 25–35% annual retention is solid; subscription models should sit far higher. The lever: post-purchase lifecycle flows in the 60 days after first order, where the keep-or-lose decision actually happens.
2. Customer churn rate
Customer churn rate is retention's mirror: the percentage of customers who stopped buying in a period. You only need to track one of the pair, but churn is often the better alarm bell because it names the loss directly.
Customer churn rate = (Customers lost during period / S) × 100
Put simply, if 100 of your 1,000 starting customers never return, churn is 10%. The churn rate formula gets tricky in ecommerce because "lost" needs a definition: pick an inactivity window (often 2× your typical purchase cycle) and hold it constant so the trend stays honest.
Healthy range: the inverse of your retention target. The lever: churn flows that intercept at-risk customers before the inactivity window closes, triggered by missed purchase cycles rather than calendar dates.
3. Repeat purchase rate
Repeat purchase rate (RPR) is the share of your customer base that has ordered more than once. It is the cleanest signal of product-market fit on the retention side: people vote with a second order.
Repeat purchase rate = (Customers with 2+ orders / Total customers) × 100
One-sentence version: out of everyone who ever bought, how many bought again? Benchmarks split sharply by category. Consumables and replenishables should reach 45–65%; durables with long cycles run 15–25%, and that is fine.
The lever: engineering the second purchase specifically, because a customer's likelihood of a third order jumps once the second lands. Our breakdown of repeat purchase revenue covers the mechanics.
4. Reactivation rate
Reactivation rate measures how well you resurrect lapsed customers: the share of a win-back audience that comes back and orders. Most brands run win-back campaigns; few measure them as a standing metric, which is why budget quietly leaks here.
Reactivation rate = (Lapsed customers who repurchased / Lapsed customers targeted) × 100
Simply put, of the dormant customers you tried to win back, how many woke up? A 5–15% rate per campaign is a realistic band, with offer depth and timing driving the spread.
The lever: segment lapsed customers by prior value before choosing offer depth. A flat 20% coupon to everyone overpays your almost-returners and underpays your high-value defectors.
Customer value metrics
Coming back is half the story. These four measure what each returning customer is worth.
5. Average order value (AOV)
Average order value (AOV) is revenue divided by order count. It is the simplest number on this list and the most abused, because discounting can grow orders while quietly shrinking it.
AOV = Total revenue / Number of orders
Meaning: the size of the typical basket. Benchmarks vary too much by category for a universal range, so track your own trend and defend it during promotions.
The lever: bundles, thresholds, and post-purchase offers. When we built cross-sell flows for Brunt Workwear, the point was exactly this: raise basket size from customers already in motion instead of buying new traffic.
6. CLV:CAC ratio
CLV:CAC compares lifetime value to customer acquisition cost (CAC), the fully loaded spend to win one new customer. This is the unit-economics verdict on the whole growth model, and the CLV:CAC ratio is usually the first number a CFO or investor checks.
CLV:CAC ratio = CLV / CAC
Translation: for every dollar spent acquiring a customer, how many dollars of lifetime profit come back? The convention operators and investors work from is 3:1, calculated on contribution margin; it is a practitioner standard rather than a law. Below 2:1 the model is fragile; far above 4:1 often means underinvestment in growth.
The lever: both sides count. Retention work raises the numerator, but creative efficiency and channel mix cut the denominator, and the ratio does not care which one you moved.
7. Customer lifetime value (CLV)
Customer lifetime value (CLV) is the total profit a customer generates across their whole relationship with the brand. It is the metric that justifies every retention investment, so it needs a margin term; revenue-only CLV flatters everyone.
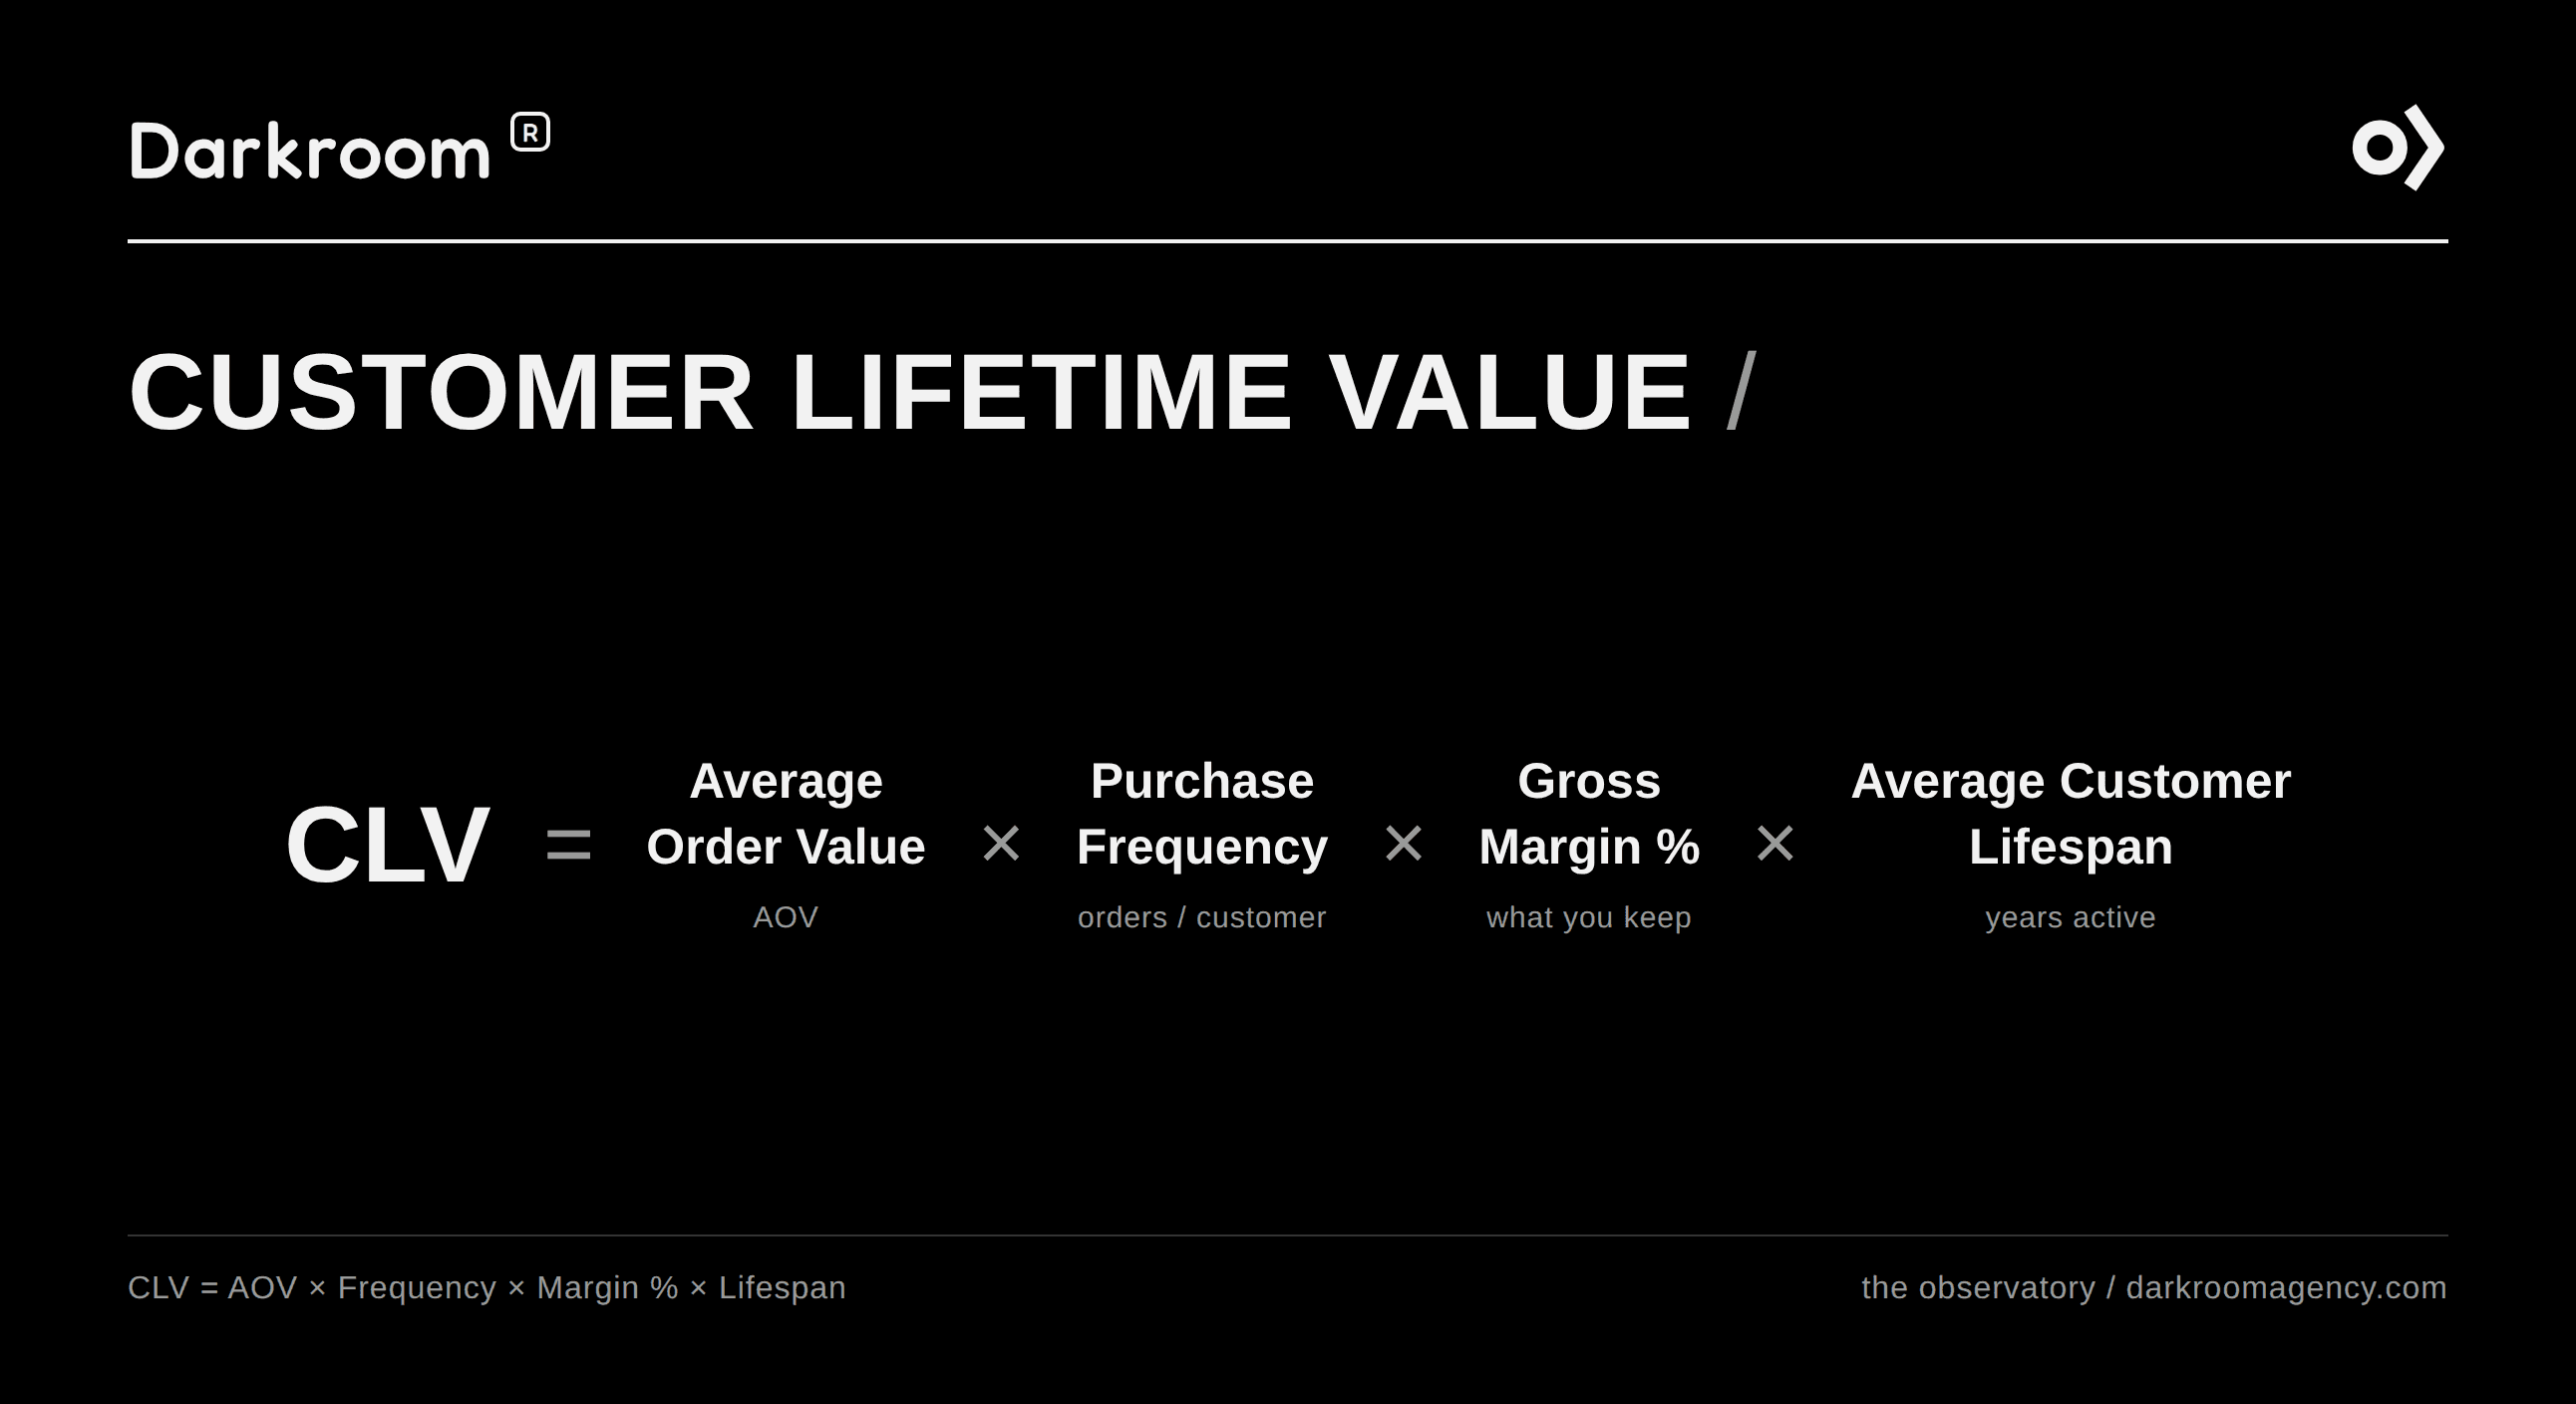
CLV = AOV × Purchase frequency × Gross margin % × Average customer lifespan
In other words: what a customer spends per order, times how often they order, times what you keep of it, times how long they stay. For worked examples and cohort-based approaches, our customer lifetime value guide goes deep so this page does not have to.
The lever: CLV is a composite, so move its inputs. Frequency and margin mix respond fastest; lifespan is the slowest but most durable gain.
8. Purchase frequency
Purchase frequency is the number of orders your average customer places over a period, usually a year. Paired with AOV, it decomposes revenue cleanly: same customers, bigger baskets, or more trips.
Purchase frequency = Total orders / Unique customers (per period)
Restated: how many times a year does a typical customer show up? Non-subscription DTC brands typically land between 1.8 and 2.5 annually; replenishable categories should push higher.
The lever: replenishment timing. If your product runs out in 45 days, the reorder prompt belongs at day 38, not in a monthly newsletter whenever it ships.
Relationship and channel metrics
The last four measure the strength of the relationship and whether you can reach it without paying rent to ad platforms.
9. Net promoter score (NPS)
Net promoter score (NPS) asks one question, "how likely are you to recommend us?", on a 0–10 scale, then compares your fans to your critics. The methodology comes from Frederick Reichheld's Bain research, introduced in The One Number You Need to Grow.
NPS = % Promoters (9–10) - % Detractors (0–6)
Plainly: the percentage of customers who would sell for you, minus the percentage who might warn people off. A score above 30 is strong for DTC. Be honest about what it predicts: NPS signals referral energy and future retention risk, not revenue this quarter.
The lever: close the loop on detractor feedback. The score is a thermometer; the verbatims are the treatment plan.
10. Time between purchases
Time between purchases is the median number of days separating a customer's orders, most usefully between order one and order two. Use the median, because a mean gets dragged around by outliers and hides your actual buying cycle.
Time between purchases = Median days between consecutive orders
In short: how long a typical customer waits before returning. There is no universal target; the goal is a stable or shrinking number that matches your product's natural cycle.
The lever: trigger timing. This metric exists to tell your lifecycle flows when to fire, which makes it the operational backbone of half the levers above.
11. Owned-channel revenue share (email + SMS)
Owned-channel revenue share is the percentage of total revenue driven by email and SMS, the channels you control without an auction. It is the metric that tells you whether retention revenue is durable or rented.
Owned-channel revenue share = ((Email + SMS revenue) / Total revenue) × 100
Said simply: how much of your money arrives through lists you own? A healthy DTC range is 25–35%. Below 20%, you are overexposed to paid; above 40%, check whether attribution is over-crediting last-click sends against current email benchmarks.
The lever: flow coverage before campaign volume. Most brands under 25% are missing automated flows entirely, not sending too few blasts.
12. Loyalty member repeat rate
Loyalty member repeat rate is the repeat purchase behavior of program members, always read against non-members. The delta between the two is your program's actual return, which is the question every loyalty budget eventually faces.
Loyalty member repeat rate = (Members with 2+ orders / Total members) × 100
Bottom line: does joining the program change behavior? A program earning its keep shows members repeating at 1.5–2× the non-member rate. If the delta is thin, the program is rewarding purchases that would have happened anyway.
The lever: benefit design over point math. Early-access drops and member-only products shift behavior; a 1% points drip rarely does.
How to read retention metrics: cohorts, not averages
Here is the trap that invalidates most dashboards: blended averages mix last month's new customers with loyalists from 2023, so the number moves whenever acquisition volume moves, not when behavior changes. Cohort analysis fixes this by grouping customers by their first-purchase month and tracking each group separately.
A minimal cohort table already tells the story:
First-purchase cohort | Month 1 repeat | Month 3 repeat | Month 6 repeat |
|---|---|---|---|
January | 12% | 24% | 31% |
February | 11% | 23% | 30% |
March | 7% | 15% | n/a |
January and February behave identically. March is bleeding, and a blended average would have hidden it for months behind strong acquisition. Reading down a column compares cohort quality; reading across a row shows how relationships mature.
Run every rate metric in this guide (retention, churn, repeat purchase, frequency) at the cohort level. The blended version is for the board slide; the cohort version is where you actually find problems while they are still cheap to fix.
Building the retention dashboard: cadence, owners, and AI
A dashboard becomes an operating document when three things are true of the customer retention KPIs on it. Every metric has one named owner. The review has a fixed cadence, monthly for cohort reviews and quarterly for CLV and ratio recalibration. And every number is paired with its lever, so a miss comes with a next action instead of a shrug. Our retention measurement framework covers the full setup, including attribution guardrails.
The 2026 upgrade is predictive. Darkroom, the retention marketing agency behind this guide, now builds AI-assisted scoring into these dashboards: instead of waiting for a customer to lapse past a window, models flag churn risk from early signals like slowing open rates and stretched purchase gaps. Lagging averages tell you what happened; scoring tells you who to save this week.
This is also where measurement converts into money. When Drip Hydration rebuilt retention around this kind of instrumented dashboard with us, the work produced an 85% increase in customer LTV alongside 50% revenue growth. The metrics did not create that lift; they showed exactly where the lifecycle work would pay.
Knowing the numbers is the entry fee. Moving them is the job. If your dashboard is built and the metrics still will not budge, that is the moment to bring in an operator. Darkroom's retention marketing program starts with a week-one diagnostic across your flows, cohorts, and loyalty economics, and turns these 12 metrics into a prioritized roadmap. Book a call.