Growth Strategy
The 5 Fastest Growing Startups in 2026 and How They Scaled




Written by Darkroom leardership
10 min read
Sep 9, 2026

For years, the standard for rapid software growth was T2D3: triple your revenue for two years, then double it for three, reaching about $144 million by year five. That standard no longer matches the fastest companies. Now, top performers hit those numbers in just two years, and a growth rate that would have led the market in 2019 is considered average in 2026.
What has not changed is how hard it is to verify these numbers. Private companies do not get audited, and revenue figures often appear without any clear source. From the outside, a company growing on its own looks just like one using venture money to boost its numbers. Both show the same growth chart. Only one will keep going when the funding ends, but you cannot see that difference in the headline numbers.
This article has two goals. First, it ranks the five fastest-growing startups of 2026 using only the numbers officially published, with dates and links, so you can check the order instead of just trusting it. Then, it explains how each company achieved its growth and which parts of their approach would still work for a business that needs to fund its own growth.
How do you measure and rank the fastest growing companies?
When we talk about the fastest growing companies, we’re really looking for those that are increasing their revenue at a pace that outstrips their spending. But here’s the tricky part: there isn’t just one way to measure this, and different sources set different standards for what counts as 'fast growth.'
The venture standard is T2D3, set out by Battery Ventures in 2015: triple revenue two years running, then double for three, taking a company from $2M to $144M. Public-market investors use the Rule of 40, where growth rate plus profit margin clears 40. Search-demand rankings track attention, not revenue.
Each of these methods has its own logic, and you could make a good case for any of them. But not all of them are easy for you to check on your own. That’s exactly why we put this list together: so you can see which companies are really growing fast, based on numbers you can actually verify.
Measure | What it counts | Threshold for "fast" | What it misses | Reader can verify |
|---|---|---|---|---|
Time to $100M ARR | Months from launch to the first $100M of annual recurring revenue | Under 3 years is exceptional; under 1 year is historic | Says nothing about margin or retention | Yes, when the company publishes it |
Revenue run-rate growth | Year-over-year change in annualized revenue | 80%+ at scale; 200%+ early | Flatters companies buying growth with venture money | Yes, when the company publishes it |
Time from founding | Years from incorporation to a stated revenue level | Under 7 years to $1B is rare | Ignores when the company actually started selling | Yes, but it is the weakest of the three; used here only where a company published no milestone timing |
Rule of 40 | Growth rate plus profit margin | 40 or above | Almost no private company publishes the margin half | Rarely |
Branded search growth | Year-over-year change in searches for the company name | Publisher-defined | Measures attention, which moves before revenue and sometimes without it | No, single-source data |
Platform revenue estimates | Modeled revenue from a company database | Publisher-defined | Estimates, not disclosures | No |
This list uses the first two, and only admits companies that published the number themselves.
The 5 fastest growing startups in 2026
Four of the five companies on this list focus on delivering core B2B infrastructure and platform capabilities rather than consumer-facing application software. Additionally, all five organizations have publicly released and self-reported their respective growth numbers and revenue milestones in official announcements.
1. Lovable: the product was the distribution

Lovable hit $1 million in annual recurring revenue (ARR), and just eight months later, they had already crossed the $100 million mark. According to Lovable, that was the fastest growth any software company had ever seen. Even more impressive, they doubled that number to $200 million ARR just four months after, reaching that milestone in November 2025.
But here’s what’s really interesting: it’s not just about the numbers. The way Lovable works is what sets it apart. Users can build software simply by entering a prompt, and whatever they create becomes a public, shareable project that anyone can access through a link.
By August 2026, Lovable had reported over 60 million projects created on its platform, and the apps built there were getting more than 900 million visits every month. Nearly two thirds of the Fortune 500 were using Lovable at that point. What’s unique is that every project is a live demo published by a customer, and Lovable doesn’t spend anything to acquire those users.
In other words, when someone uses Lovable, they’re also helping distribute it at the same time.
2. Mercor: supply growth arrived before revenue growth

Mercor grew from zero to a $500 million run-rate in just 17 months, and passed $1 billion annualized in early 2026. During that time, platform volume increased from $200,000 to over $14 million each week.
Revenue isn’t the most important number here. Mercor connects domain experts with AI labs that need training data. By May 2026, it was paying out over $3 million a day to more than 30,000 active contractors each week.
In a marketplace, payouts come first and revenue follows. Supply has to be in place before you can meet demand, so Mercor intentionally spends ahead of revenue. This let them see if their strategy was working weeks before it appeared in sales numbers. That’s the key lesson, and it’s less common than you might think. Most growth teams only track results after the fact.
3. Sierra: pricing attached to a resolved outcome

Sierra reached $100M ARR in seven quarters and $200M in nine, disclosed August 2026, about two and a half years after launch, and raised $950M above a $15B valuation in May 2026.
Sierra sells customer-facing conversational AI to large enterprises and prices on outcomes rather than seats: the customer pays when the AI resolves an issue. That removes the argument stalling most enterprise deals, because the buyer stops forecasting license counts. It also aligns vendor revenue with what the buyer wants, shortening the second and third contract far more than the first.
The customer mix explains the ARR shape. As of August 2026 Sierra reported over 40% of the Fortune 50, one in three leading banks, and five of the ten largest healthcare companies in the world. Fewer, larger contracts, each expanding.
4. ElevenLabs: the API was the channel

By the end of 2025, ElevenLabs had reached $350 million in annual recurring revenue. Then, in just the first four months of 2026, they shot past $500 million. That’s a 43% jump in a very short time, and it’s especially impressive because most companies start to slow down at this size.
ElevenLabs is all about voice synthesis, and here’s something interesting: they started by selling directly to developers. Why does that matter? When a developer adds a voice API to their own product, every time their product grows, so does ElevenLabs, without having to make another sale.
It’s a bit like how Lovable’s public projects grow through sharing, but here, growth happens through integrations instead of links.
5. Ramp: a wedge narrow enough to be obviously better
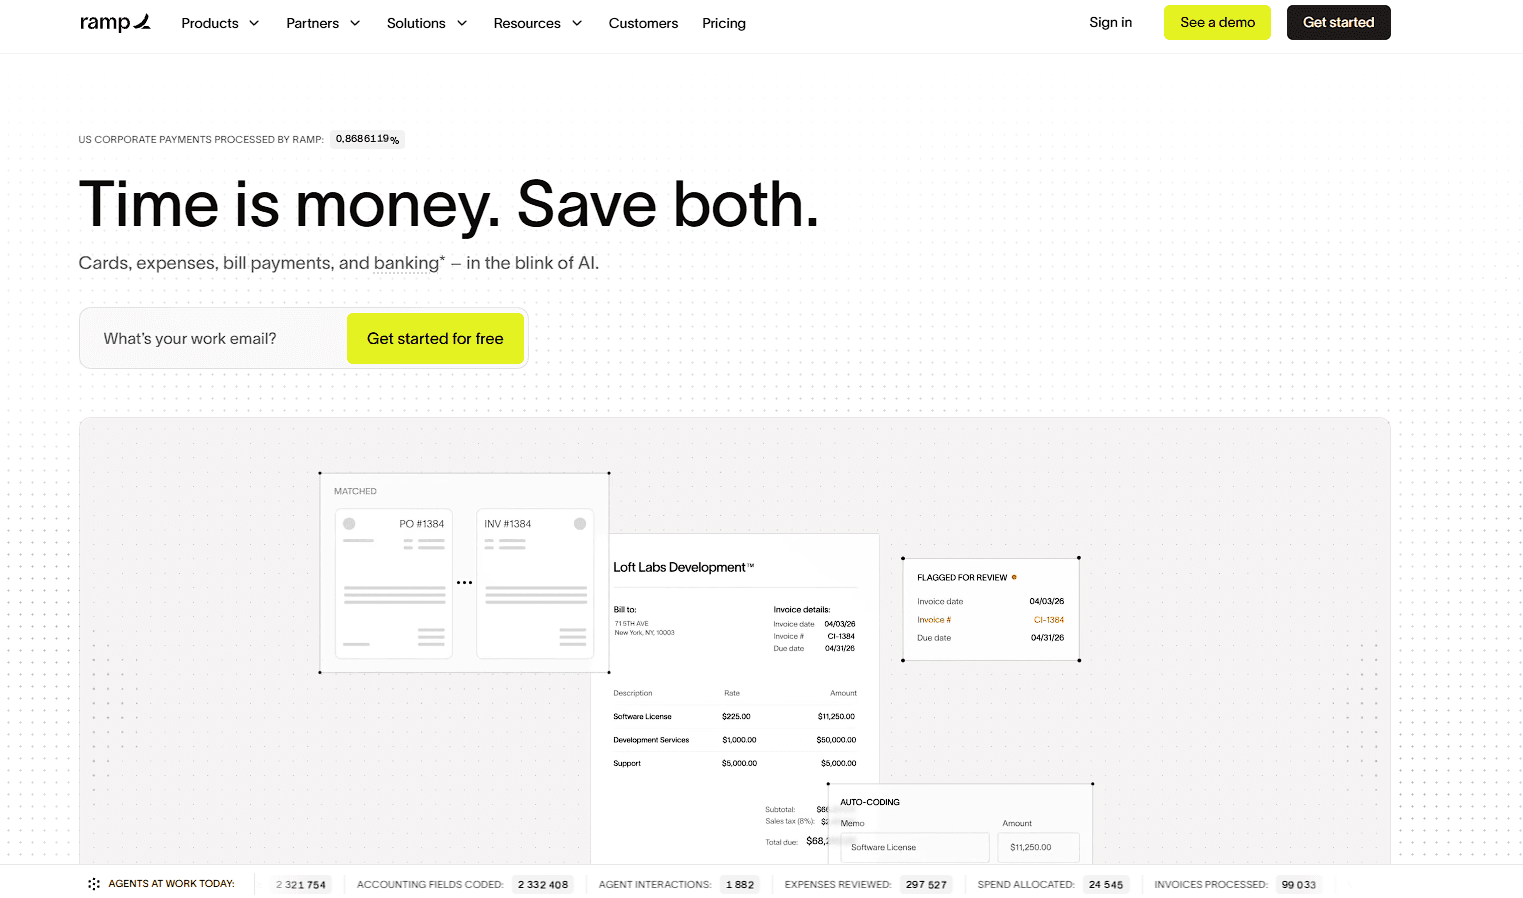
Ramp reported over $1B in annualized revenue with positive free cash flow in June 2026, alongside 70,000+ customers, 3,200+ of them at $100,000 or more a year, and purchase volume up roughly 170% year over year as of March 2026, its fastest in three years.
Ramp is the most useful entry here for anyone not running an AI infrastructure business. It is the only company that published a growth rate rather than a level, which is what you need to judge acceleration, and the only one showing positive free cash flow alongside triple-digit volume growth. That is the distinction between compounding growth, which gets cheaper per customer, and funded growth, which gets dearer.
The launch mechanics are in our breakdown of how Ramp chose its wedge. Ramp did not try to be a better bank. It picked corporate card expense management, made that job unambiguously better, then expanded inside accounts it had already won.
Like ElevenLabs, Ramp has never published a time-to-milestone figure, so it is ranked on time from founding to $1B+ annualized revenue, roughly six and a half years.
What do the fastest growing tech companies have in common?
A common feature among the rapidly growing technology companies is that their distribution channel becomes cheaper on a per-customer basis as the company grows; all other aspects are a result of this.
The same four patterns can be seen in Lovable, Mercor, Sierra, ElevenLabs and Ramp in the figures that have been published rather than being inferred.
The product creates the marketing artifact: Lovable's 60 million projects and ElevenLabs' developer integrations both turn usage into the thing that acquires the next customer. Acquisition cost falls as usage rises.
Expansion revenue outruns new logos: Sierra's move from $100M to $200M ARR came substantially from existing accounts getting larger, and Ramp reports 3,200+ customers above $100,000 a year. Growing one customer repeatedly beats winning three.
Pricing is attached to an outcome: Sierra charges per resolution: the least copied and most portable idea here.
One channel, deliberately: None of them ran five channels at 20% effort. This is the pattern most relevant to consumer technology marketing, where the pull to cover every surface is strongest.
Running it across a portfolio rather than one channel is the core of an AI-native operating model: the useful version of AI here is not writing more ads, it is modeling which channel is still compounding two quarters out, before the budget is committed.
How do the fastest growing SaaS companies keep compounding after the first $100M?
Ever wonder how the fastest-growing SaaS companies keep getting bigger even after hitting $100M in revenue? The secret is net revenue retention.
This metric tells you what percentage of last year's revenue comes from this year's existing customers, before you even think about adding new ones. If your net revenue retention is over 100%, it means your current customers are spending more with you each year, so your business grows even without new sales.
Let’s take Databricks as an example. They’re not a startup anymore, as they were founded back in 2013. By August 2026, Databricks hit a $7 billion revenue run-rate and was still growing at over 80% year over year. That’s huge. They also had more than 1,000 customers spending over $1 million each, and over 100 customers spending more than $10 million.
This idea isn’t just for SaaS. If you run a direct-to-consumer (DTC) brand, net revenue retention is basically your repeat purchase rate, just with a different label. Ask yourself: how much are last year’s customers spending with you this year?
If your returning customers spend more every year, you’re achieving the consumer version of 140% net retention. That means you’ll outpace competitors with flashier ads who can’t keep customers coming back.
To understand what’s happening, look at customer lifetime value and track results with a cohort curve instead of just averages. This gives you a clearer picture of how your customers behave over time.
What does a startup growth strategy look like when you write it down?
A written startup growth strategy is five decisions on one page, not a plan. Longer than a page and nobody uses it to say no to anything, its only job.
Name the single channel and why it compounds: Write the mechanism, not the channel. "Paid social" is not an answer. "Creator content, because cost per acquisition falls as the roster grows" is.
Set the constraint you are optimizing against: Contribution margin, payback period or absolute growth. Pick one. A team optimizing two will optimize neither.
Define the one metric that would falsify the thesis: If CAC rises three months running at flat volume, the thesis was wrong. Deciding in advance stops a bad channel surviving on narrative.
Set the review interval before you start: Weekly for a new channel, monthly once proven. The interval is a commitment not to relitigate in between.
Decide in advance what result closes the channel: The hardest one, and why most growth plans fail. Ramp picked one job and refused adjacent ones until it was won.
Every company here could answer all five in a sentence. That is the difference between a startup growth strategy and a list of tactics.
How do you tell whether your own growth is compounding or just funded?
Growth is compounding if it survives three tests: contribution margin holds as spend rises, the second cohort behaves like the first, and the channel survives an incrementality test. Funded growth fails at least one and usually all three.
Does contribution margin hold as spend rises? Growing revenue while contribution margin falls means buying volume at worse prices. Track marketing efficiency ratio against contribution rather than revenue and the picture usually changes.
Does the second cohort behave like the first? If customers acquired six months ago repeat at a lower rate than those from eighteen months ago, the channel is reaching worse customers as it scales. Ramp's positive free cash flow alongside ~170% volume growth is the rare public example of it holding.
Does the channel survive an incrementality test? Most do not, entirely. In the incrementality tests we run for clients, platform-reported return on ad spend (ROAS) is typically overstated by 20 to 40%, meaning a real share of the growth you pay for would have happened anyway.
Darkroom is an AI-native growth marketing agency for enterprise consumer brands. We run these three diagnostics inside Shadow, our commerce modeling layer, and the output becomes a Flight Plan: a live forecast with pacing against it, so whether a channel is compounding gets answered before the next quarter's budget is committed.
To run that against your own numbers, start here.