MARKETING ANALYSIS
Power Analysis in Marketing, Explained for Non-Statisticians




Written by Darkroom leardership
Last update: August 7, 2026

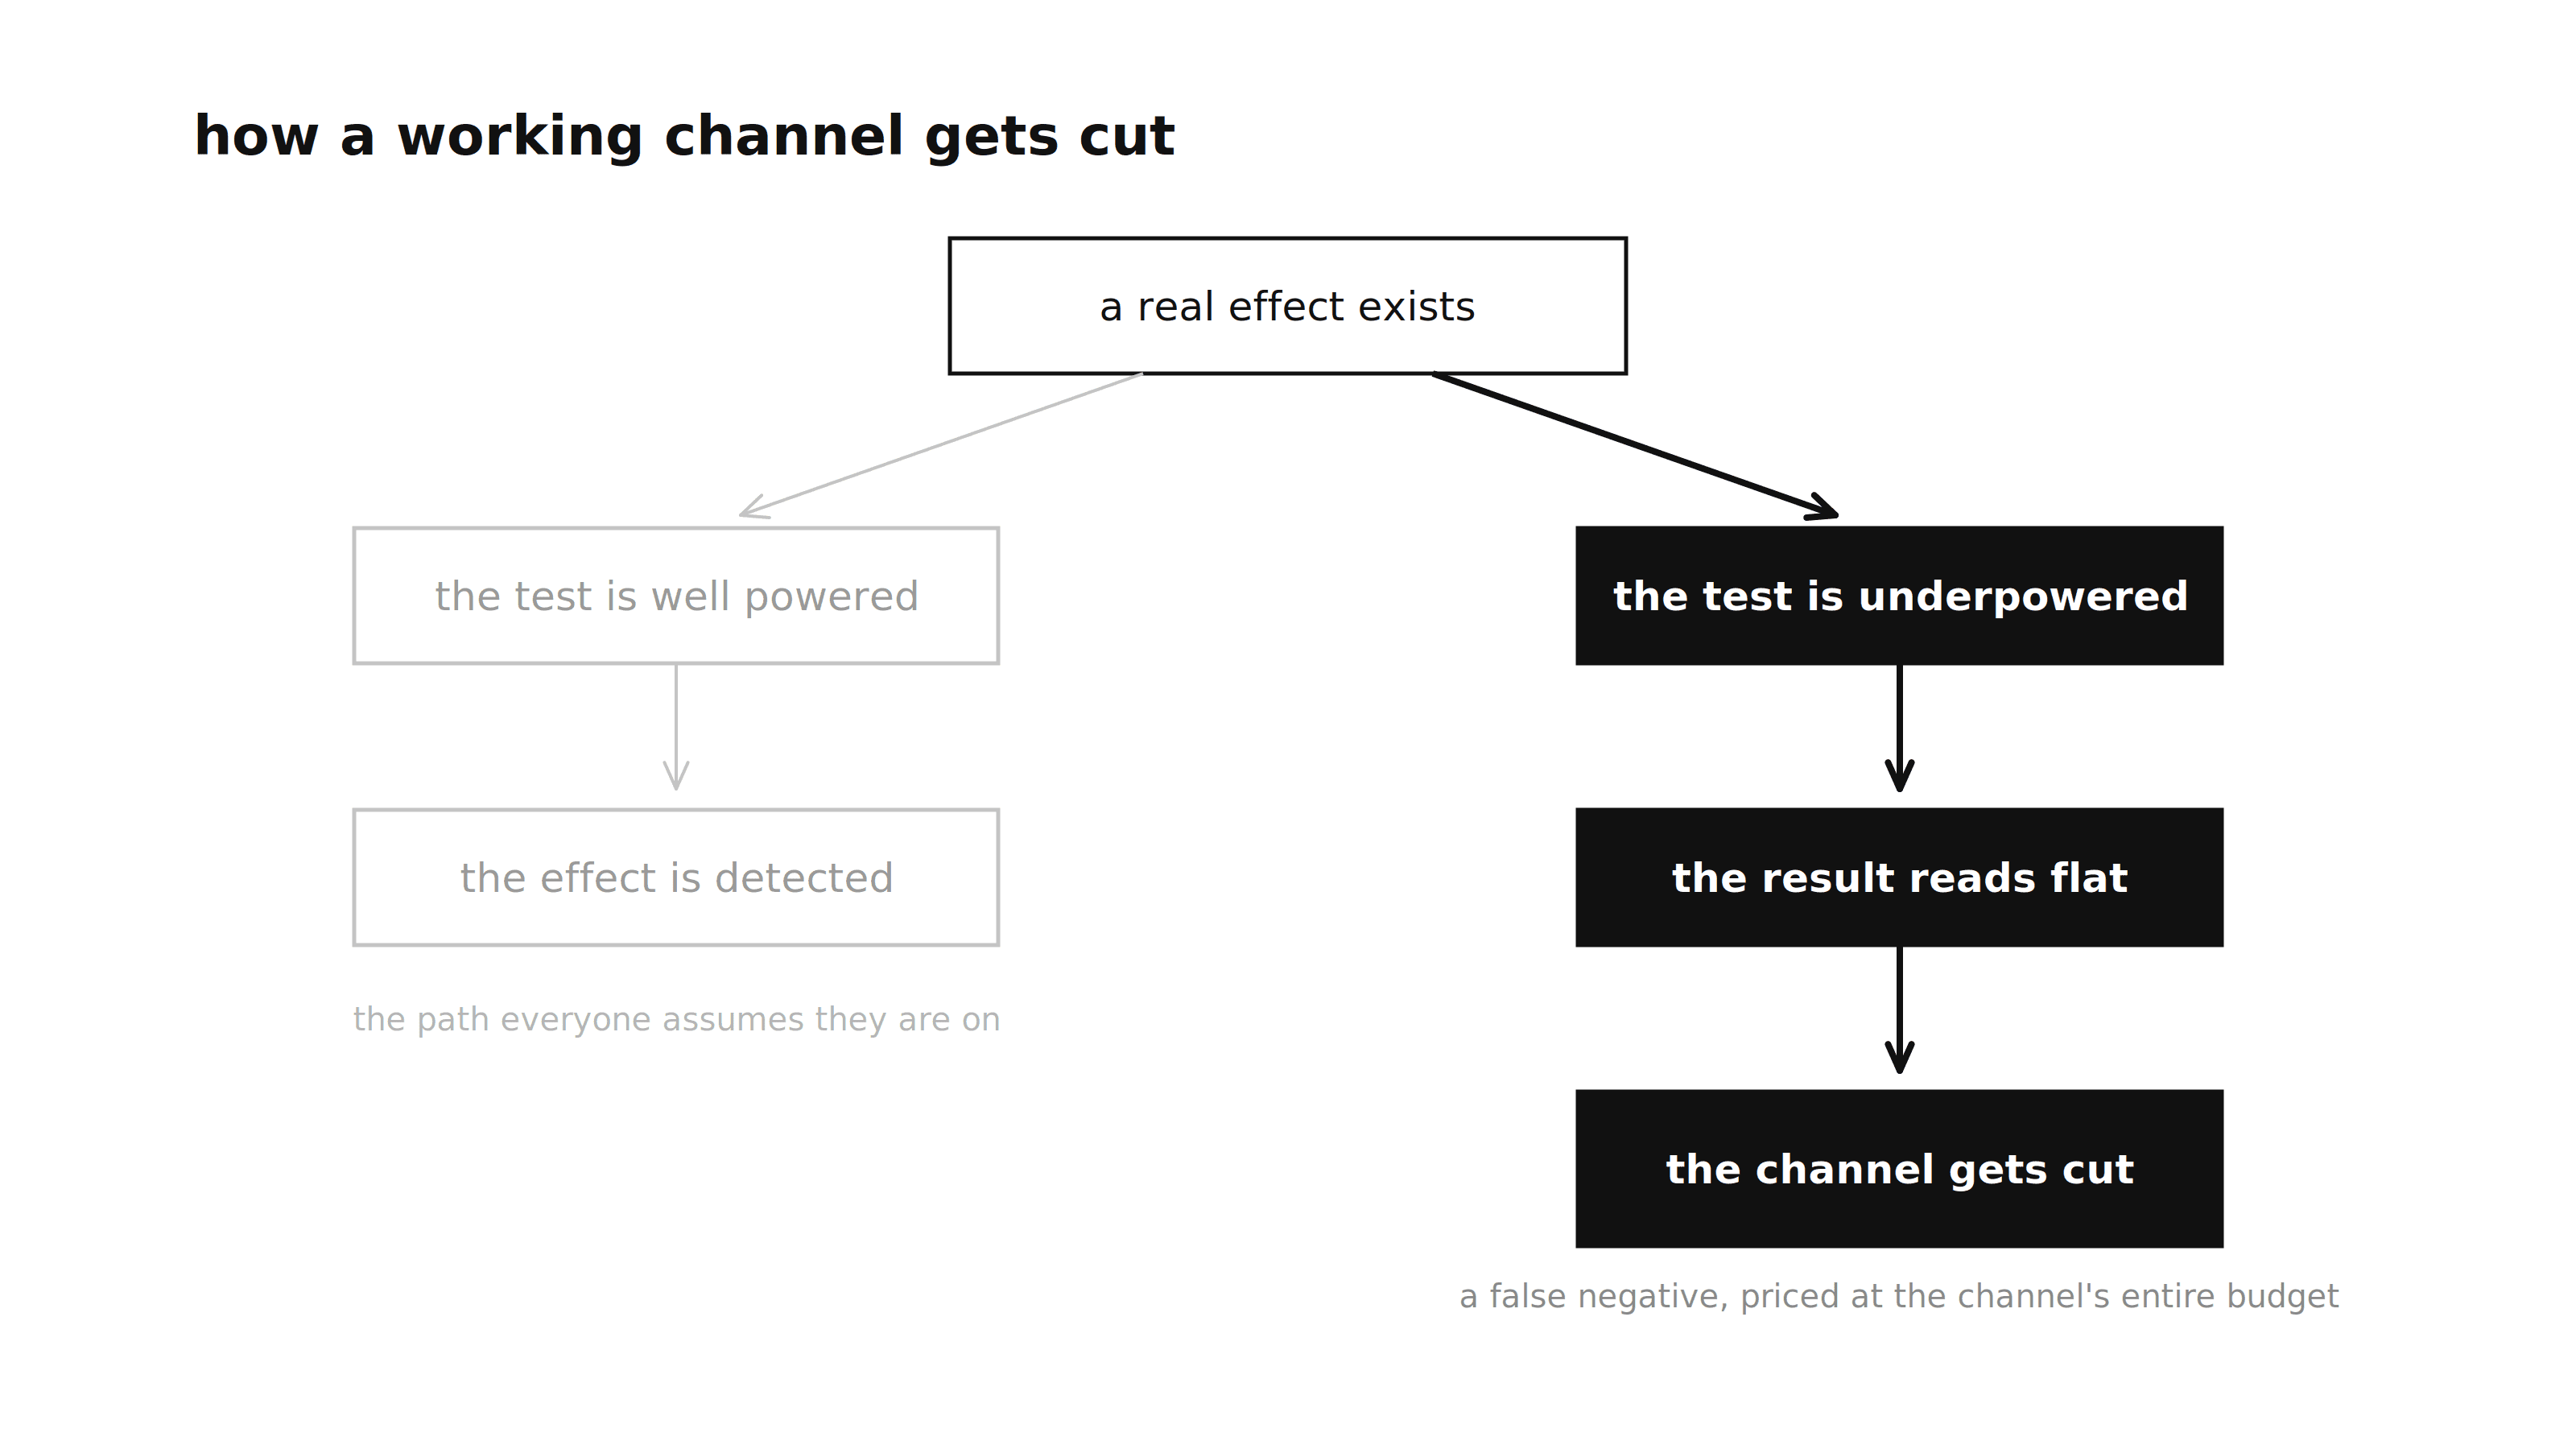
Most brand tests are not wrong. They are underpowered, which is worse: a flat result from an underpowered test is not evidence of no lift, yet working channels get cut on that reading every quarter. Platform-reported lift was already suspect; the test built to replace it often cannot answer the question either.
To fix scope in one sentence: this is power analysis for marketing experiments, geo holdouts and on-site tests, not electrical systems and not Power BI. If geo experiments are becoming the source of truth for measurement, this arithmetic decides whether yours can be trusted.
What is power analysis in marketing?
Power analysis in marketing answers one question before launch: can this test see the effect you care about, with the data you have, at the confidence you need? Run it afterward and it can only tell you what you should have built.
Every credible treatment of the subject agrees on the same four parameters. What varies is how honestly they get traded against each other.
Parameter | Plain English | Convention | What turning it up costs |
|---|---|---|---|
Minimum detectable effect (MDE) | Smallest lift the test can reliably find | Chosen per test; Darkroom's geo standard is 5% | Smaller MDE needs quadratically more data |
Sample size | Visitors, orders or markets in the test | Thousands of users for A/B; 12 to 15 markets per side for geo | More spend, longer runtime, more holdout revenue |
Significance (alpha) | The false-positive rate you accept | 0.05 | Stricter alpha needs more data |
Power (1 minus beta) | The odds of catching a real effect | 0.80, which still misses a real effect one time in five | Higher power needs more data |
One distinction unlocks the topic. The statistical significance marketing teams report controls false positives; power controls false negatives. Darkroom, a growth marketing agency for consumer and enterprise brands, treats the second risk as the expensive one, because a false negative defunds a working channel.
How is statistical power actually calculated?
For a conversion test, the statistical power calculation is closed-form: divide the difference in conversion rates by its standard error, and power is the share of outcomes that, if the true effect is real, land beyond the significance threshold.
Sam Arrington's derivation on Towards Data Science (November 2025), building on Larsen and Marx's textbook treatment of the method, works it through a two-proportion z-test: at 1,000 users per group and true rates of 10% versus 15%, one-sided power comes out near 96%. Run it two-sided, which most commercial testing platforms do by default, and the same setup gives about 92%. Large effects need little data; the trouble starts when effects are small.
Two rules travel with the math. Run it a priori, before the test; computing "observed power" after a null result adds nothing the p-value did not already say. And notice the assumption doing the work: thousands of independent observations. That holds on a website but fails in a geo test, where most media budgets are actually measured.
What is a minimum detectable effect?
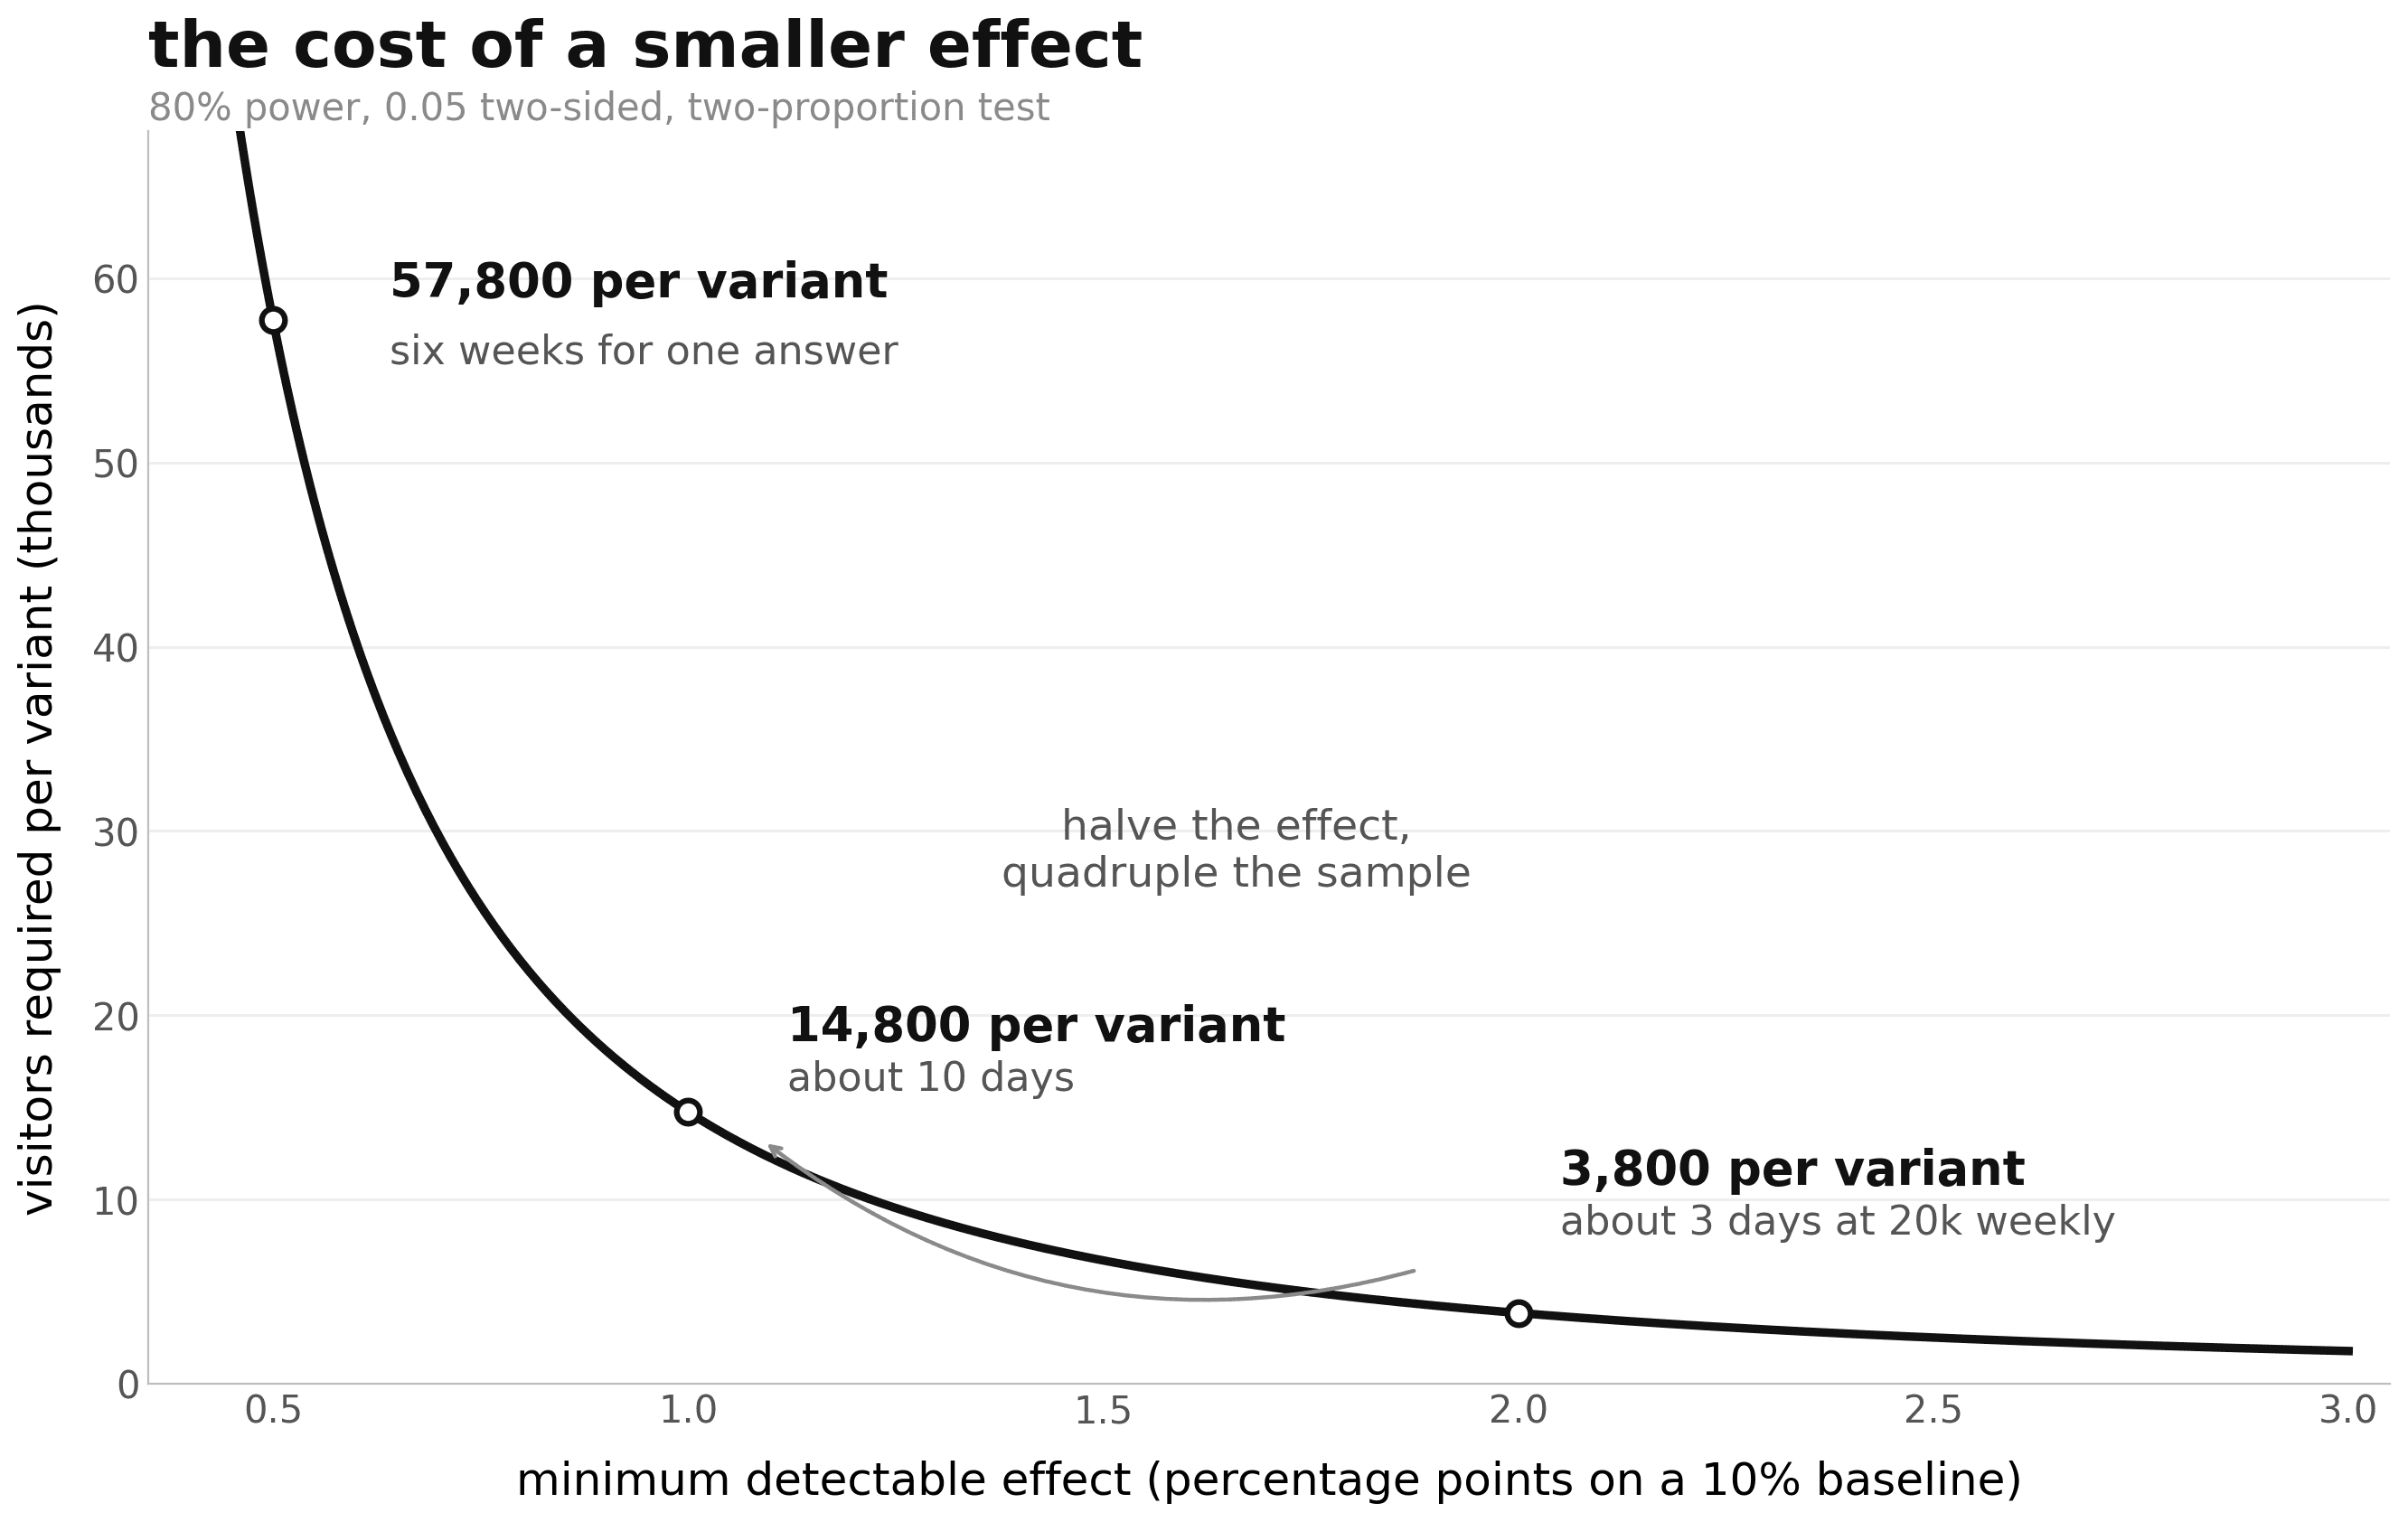
The minimum detectable effect is the smallest lift your test can reliably find, fixed by the design before launch. Everything else flows from this number, because the effect size you want to see determines the data you need, and the cost curve is steep: required sample scales roughly with the inverse square of the effect. Halving the MDE quadruples the sample.
Work it yourself and the curve becomes obvious. Detecting a 2 percentage point lift on a 10% baseline conversion rate, at 80% power and 0.05 two-sided significance, needs roughly 3,800 visitors per variant; at 20,000 weekly visitors, that is about three days. Halve the target to 1 point and it becomes roughly 14,800 per variant, or ten days. Halve it again to 0.5 points and you need about 57,800 per variant: six weeks for one answer.
The tests that eat a quarter are the tests looking for small effects, not the tests looking for big ones. Which is why the common mistake matters: teams go setting targets by hope, sizing the test for the lift in the forecast deck. A test sized for the dream lift and hit with the real one reads flat.
How do you set an MDE from business math rather than convention?
Two quantities get conflated here, and naming both is half the answer. The effect worth acting on is a business choice. The minimum detectable effect is a design property. Set the first from your economics, then size the design so its MDE sits at or below it; otherwise, the test cannot see what you care about.
The floor comes from the profit and loss statement. Break-even lift on a channel is a function of contribution margin, so a thin-margin business needs a bigger lift to justify the same spend, and a bigger MDE to match. A statistically significant 0.1% improvement can be economically irrelevant; if a 3% lift would not move a dollar of budget, do not pay to detect 3%.
The threshold also depends on the decision. Creative testing tolerates larger MDEs, because the decision is which asset to scale. Channel on/off calls need smaller ones, because millions of dollars ride on them.
Why are most brand marketing tests underpowered?
Because the test gets sized by the media plan rather than by the math, and nobody prices the cost of a false negative. Four failures recur:
The MDE was aspirational, sized to the forecast deck rather than to the smallest lift that would change the decision.
The geo count was whatever the plan allowed. Eight markets were available, so eight were used, and the power calculation never ran.
The test was called early, on a scary week-two dip or an exciting week-three spike.
The key performance indicator (KPI) is volatile. High average order value (AOV) and low purchase frequency inflate variance, so considered-purchase brands need larger MDEs than they expect.
The consequence: at 80% power, a properly sized test still misses a real effect one time in five, and most brand tests run well below that. So "no lift detected" gets read as "no lift", and a channel gets cut on the strength of an underpowered study that could never see it.
That loss never appears in a report, which is why incrementality testing is a budget question rather than an analytics preference.
One correction, because the error is widespread: a non-significant p-value does not tell you a test was underpowered. Power is a property of the design, set before launch. A flat result from a well-powered test is real evidence of no meaningful effect; from an underpowered one, it is evidence of nothing.
How many geos do you need for a geo holdout test?
At least 12 to 15 geographic units on each side, the standard Darkroom applies in geo experimentation for paid media. The number moves with three things: variance between your markets, how well control tracks treatment before the test, and the MDE you chose.
The visitor arithmetic from on-site A/B testing does not transfer, and an A/B test sample size calculator will mislead you here. The differences are worth seeing side by side:
Dimension | On-site A/B test | Geo holdout |
|---|---|---|
Unit of measurement | A visitor or user | A market |
Typical sample | Thousands per variant | 12 to 15 markets per side |
Independence | Observations roughly independent | Markets differ in size and volatility; trends correlated over time |
Power math | Closed-form z-test | Simulation over your own historical data |
Duration ceiling | Browser storage limits | Seasonality and purchase-cycle contamination |
What fixes a short design | More traffic or a bigger MDE | More markets or a bigger MDE, never just more weeks |
What replaces the closed form is a matched-market design judged on the pre-period, with power estimated by simulation: replay your own history, inject synthetic lifts of different sizes, and count how often the design detects them. That simulation, run over synthetic control and difference-in-differences estimators, is how you size a geo test.
GeoLift, released through Meta Open Source, does exactly this and is free. The project describes itself as for research purposes only and not a Meta product, so treat it as a method you own rather than vendor-supported software.
The practical failure: eight markets chosen by media availability cannot be rescued by a longer runtime. And none of this applies to media mix modeling, which estimates lift from history rather than testing for it; power is a property of experiments.
How long should a marketing test run?
Four to six weeks of treatment exposure, plus a clean pre-period before and a tail after long enough to cover conversion lag. Most teams budget only the middle segment, which is how a six-week test becomes a ten-week calendar commitment nobody approved.
Two constraints break more tests than the math does. A purchase cycle longer than the test window guarantees an understated result, because conversions caused inside the window land after it closes. And seasonality inside the window contaminates the control match, so a promo belongs in both cells or in neither.
Adding weeks does not substitute for adding markets: repeated observations of the same geos are correlated, so extra runtime buys less power than it appears to.
On-site tests face the opposite ceiling. Safari's tracking prevention deletes JavaScript-set cookies and all script-writable storage after seven days of browser use without user interaction, and caps expiry to 24 hours where link decoration is involved (WebKit policy, checked August 2026). A client-side test running past a week is therefore measuring a shrinking, self-selected population; limits differ by browser, so check your own traffic mix.
Geo tests escape this because the unit is a market, not a browser, and duration calculators built for on-site traffic model none of it.
The forward-looking version: sequential and Bayesian designs stop a test when the evidence is sufficient rather than at a fixed date. For brands testing continuously, that changes the cost of experimentation more than any tooling upgrade: expensive tests end early, cheap ones run as long as needed.
What you can copy: sizing your next test before you buy it
Step | What it protects you from | The internal blocker it will hit |
|---|---|---|
Write down the decision the test informs, before choosing any number | Tests that produce a reading nobody acts on | Nobody wants to commit to a decision in advance |
Set the MDE from contribution margin, not the forecast | Paying to detect lifts too small to matter | Finance treats holdout revenue as pure loss |
Count usable geos before committing budget | Designs doomed at launch | Geo-level revenue is not clean in the data infrastructure |
Agree the stopping rule in writing before launch | Week-two peeking, in both directions | Someone senior will want an early read |
Run the power calculation and publish it, even when the answer is "unaffordable" | Spending on a test that cannot answer the question | The honest "do not run this test" is politically hard |
That last row separates a testing programme from testing theatre. Sometimes the honest conclusion is that the clean answer is not worth its price this quarter, and a measurement stack earns its keep by surfacing that before the money is spent. The same discipline is what lets you evaluate acquisition channels on evidence rather than on attribution folklore.
Talk to a team that sizes the test before it sells you one
A powered test is what lets you reallocate budget with confidence, and it is what makes predictive measurement trustworthy. Darkroom runs marketing experimentation this way for high-growth brands across consumer, mid-market, and enterprise.
Test design and sizing before spend: MDE from your margins, geo counts from your data, duration from your purchase cycle.
Measurement infrastructure that makes the answer readable, the way we built a performance dashboard system from scratch for Tini Lux.
A growth strategy layer where Shadow, Darkroom's measurement platform, connects test results to budget decisions.
Darkroom partners with brands doing $10M to $500M in revenue, from direct-to-consumer (DTC) to mid-market retail.
Power analysis in marketing FAQs
What is power analysis in marketing?
It is the planning step that estimates, before launch, the odds a marketing experiment will detect a given effect. It combines four inputs, the minimum detectable effect, the sample size, the significance level and the power target, into one feasibility check. Skipping it risks running a test that could never answer its own question.
What is a minimum detectable effect?
The minimum detectable effect (MDE) is the smallest lift a test can reliably find, a property of the design fixed before launch. Size it at or below the smallest effect that would change a real budget decision. A smaller MDE is dramatically more expensive: cutting it in half roughly quadruples the required sample.
What is a good statistical power level for a marketing test?
80% is the standard convention, and it still means missing a real effect one time in five. Use 90% when a wrong call is costly to reverse, such as cutting a major channel. Materially below 80%, flat results become uninterpretable, which defeats the purpose of testing.
How many geos do you need for a geo holdout test?
Under Darkroom's published standard, at least 12 to 15 geographic units per side, assuming well-matched pre-period trends and a roughly 5% minimum detectable effect. Fewer works only when markets are unusually stable or the expected effect is large. Verify by simulation on your own history, not a visitor calculator.
How long should a marketing incrementality test run?
Four to six weeks of treatment exposure, plus a clean pre-period and a post-period covering your conversion lag. Long purchase cycles need longer tails, or the result understates the true effect. Extending the treatment window is not a substitute for adding markets, because geo observations are correlated over time.
What does it mean if a test is underpowered?
The design could not reliably detect the effect it was looking for, so a flat result is evidence of nothing. Power is a property of the design, set before launch; it cannot be inferred from a non-significant p-value afterward. Underpowered tests are how working channels get cut by mistake.
Does a bigger budget fix an underpowered test?
Only if it changes the design. Extra spend that adds treatment markets, extends the pre-period data, or targets a larger expected effect genuinely buys power. Extra spend poured into the same geos over the same window changes nothing, because the constraint is the number of independent observations, not the size of the invoice.
Can you run a power analysis without a statistician?
Yes, for standard cases. Conversion tests use closed-form calculators, and open-source tools like GeoLift simulate power for geo tests on your own data. The input that genuinely requires judgment is the minimum detectable effect, and that is a commercial decision about what lift matters, not a statistical one.